Do Rising Interest Rates Hurt Stocks?

By Jason McIntosh | Published 28 April 2022
A question on many investor minds right now is: do rising interest rates hurt stocks? I’m going to show you a chart in a moment. It’s a fascinating chart that you’ve probably never seen it before, and it’s going to help answer that question.
But before I do that, I’m going to give you a quick from my last article, because it’s got some really important implications for the question about do rising interest rates hurt stocks?
Have a look at this:
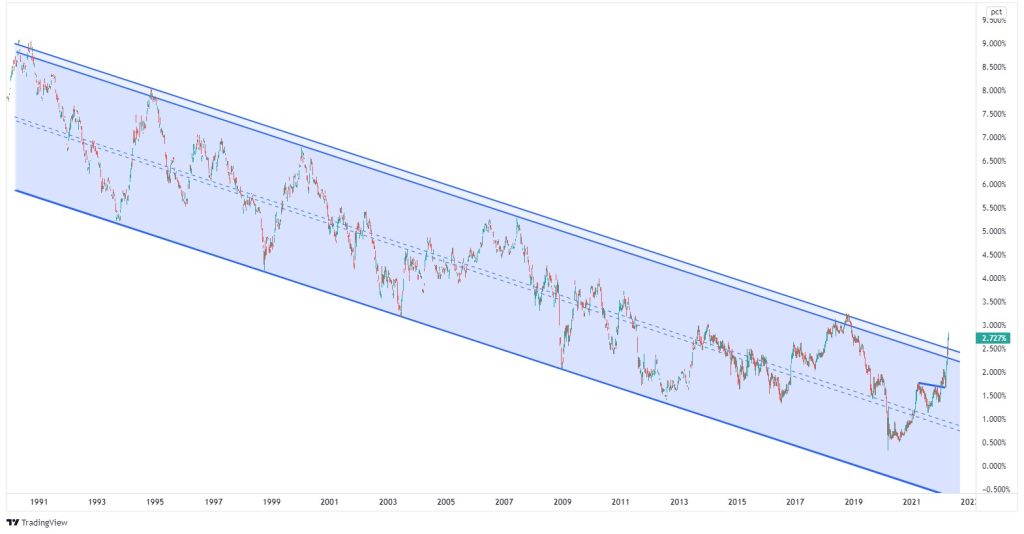
This is the U.S. 10-year government bond yield. You can see it’s been trading lower in a big downward trend channel over the last 30 years. It’s one of the longest chart patterns you’re going to find in financial markets.
The significant development I brought to your attention in my last article was a breakout from the trend channel. The breakout potentially signals a new upward trend in bond. And this could be a big deal for financial markets should the trend continue.
What I’m going to do now is compare bond yields to stocks. I think there’s a widely held misconception that higher interest rates mean lower stock prices.
But do you know what? That’s not necessarily the case.
Have a look at this:
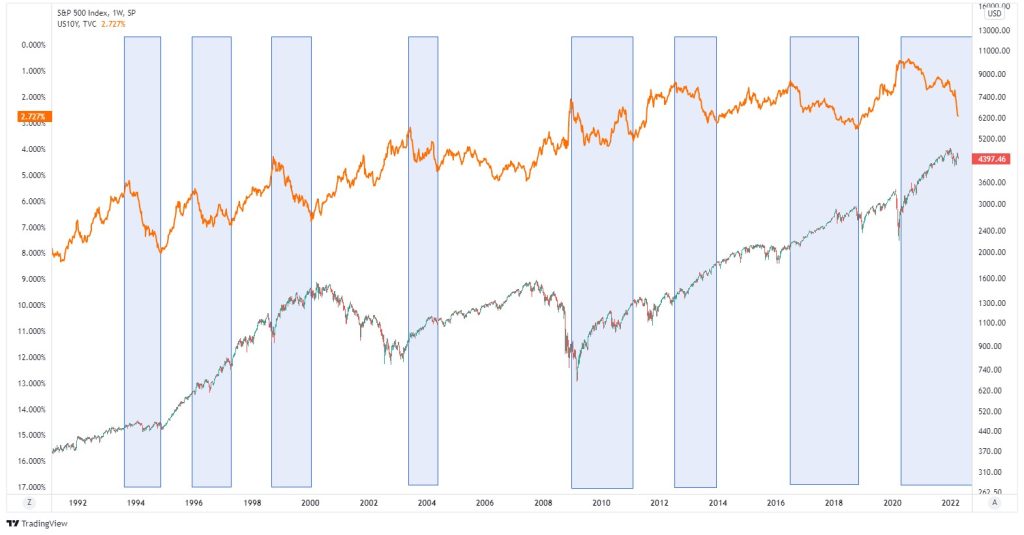
This graph compares the S&P 500 (blue line) to the US 10-year bond yield (orange line), and it goes back to 1992. So that you know, the S&P 500 chart is on a log scale so you can easily see the movements at lower prices.
Another important thing to note is that I’ve inverted the bond yield. So when the line is rising, the yield is actually falling, and vise-versa. This is going to help make some comparisons.
Now, look at these blue-shaded areas on the chart. These are periods where you can see the bond yield has been rising. All through these periods here, the bond yield has been going up. And now project that down to the S&P 500 chart, and look what the market did during those periods. Most of the time, despite the bond yield rising, the market has gone up. Not on a one-for-one basis or a day-to-day basis. But overall, that’s been the pattern during those periods.
And so the question is, why is that? Why are stocks rising when yields are rising, or interest rates are going up? All too often, we’re told that as soon as interest rate goes up the market is going to fall.
Well, it’s because, broadly speaking, higher interest rates are often an indicator of a strong economy, not a weak one. And when the economy is strong, the stock market typically goes up.
There’s a lot more complexity to it than just doing an overlay chart. But it provides a broad overview that higher rates don’t necessarily mean the stock market is going to fall away. If the multi-decade trend in lower bond yields (which I speak about here) is changing, then maybe this relationship with stocks will also shift. Should that happen, I believe the charts can help us identify and navigate that shift.
And that’s what this is all about. It’s about making you aware of the possibilities so that you’re better prepared for whatever the market does next.
Looking for the best ASX stocks to buy now?
Motion Trader‘s algorithms scan more than 2,000 ASX stocks daily in search of medium term investment trends. We then tell our members precisely when to buy shares. And most importantly, we tell them when to sell.
Try a no obligation FREE 14-day trial of Motion Trader, and see what an algorithmic trading approach could do for you.
Meet Jason

I'm Jason McIntosh, the creator of Motion Trader. My career began in 1991 on the trading floor at Bankers Trust. Nowadays, I trade my own systems from home in Sydney.
Motion Trader is for investors who value robust analysis, data driven entry and exit signals, commentary, and education. I use engineered algorithms to identify when to buy and sell ASX stocks. No biases or guesswork, just data driven signals.