The Best Contrarian Indicator Ever?

By Jason McIntosh | Published 28 May 2022
Contrarian indicators can often be the best guide to where the stock market is heading. And I have two classic contrarian examples for you. I’m always fascinated by sentiment because it can give you clues into the mindset of the investing world en masse. And when a topic becomes fever-pitched, it’s often a time to consider the other side.
Check this out:
I saw this image (and the next one) via my Tweeter feed during the week.
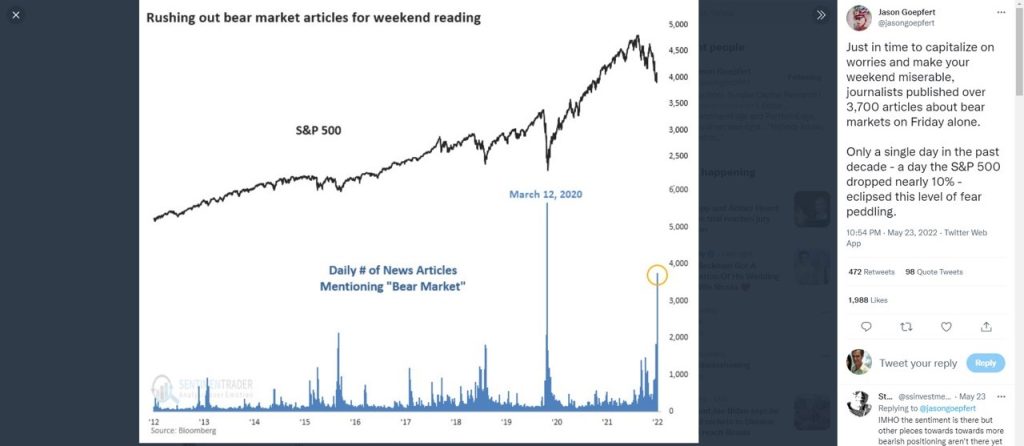
The top portion of shows the S&P 500. Below it is a bar graph. This shows the number of news articles which contain the words “bear market” in a single week. As you can see, the recent volume of bearish articles is the second highest in 10 years. The only time there was more bear market mentions was near the lows of the Covid crash.
There are several other spikes in bearish articles. And what’s interesting is that they all coincide with lows in the market. In some cases, the lows are just modest pullbacks. But on others, they are more significant corrections. The articles typically don’t pre-empt the bearish phases. Rather, the bulk of them come near the tail end of the market weakness.
I don’t know whether we’ve seen a final low for the latest sell-off. But it does feel like we’re nearing that point of maximum pessimism at least in near term, and that a relief rally is due.
The next image is one of my favourites. It’s in the style of the famous magazine cover from the 1970s. It from a magazine called Newsweek, and the cover was “The Death of Equities“. It was 1979 and it was within a year of the mega bull market of the 1980s. It was a big contrarian indicator…. it was saying no one was ever going to buy shares again, and lo and behold, they did.
This time, the covers are from Barron’s.
Have a look at this:
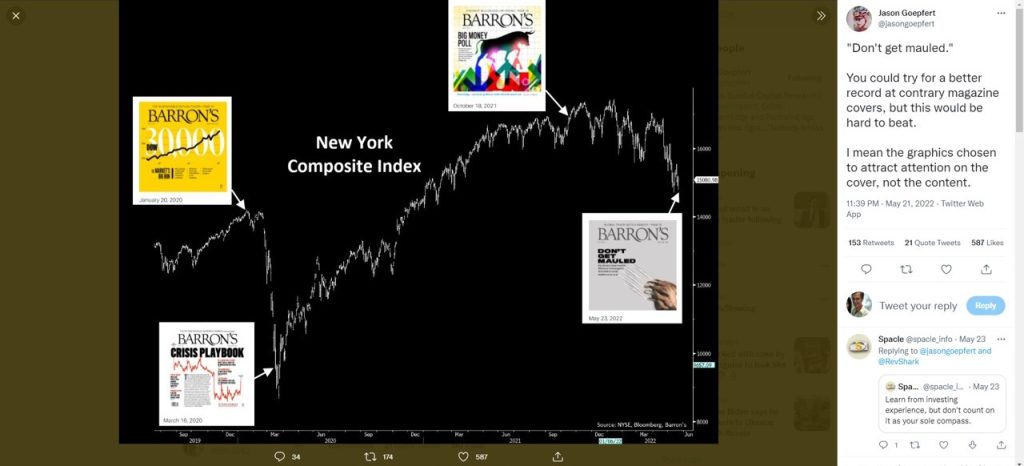
You’ll see the covers overlaying a chart for the New York Composite index. Near the pre-Covid highs, Barron’s came out with this big yellow cover saying: “30,000 on the Dow”. It had a prominent upward trend that captures your attention. Sure enough, the market soon fell. No one knew Covid was about to hit. But that was the bullish sentiment of the time.
Fast forward to the depths of the Covid crash, and the cover was the “Crisis Playbook”. The sentiment the cover picks up on is one of negativity. And it comes in right near the market lows.
Within a couple of years, sentiment was again strong. Look at the cover in the top right of the image. It shows a bull marching higher, with the title: “Big Money Poll”. The image it portrays is one of bullishness and positivity. And again, it preceded a significant fall.
I haven’t read the articles and I don’t know their contents. They could be balanced when you read them. But that’s not the point. The point is getting inside the psychology or the mindset of the market. And the editors are trying to draw on that each time. They’re using overly bullish or bearish images to grab readers attention.
This is why investor sentiment is often a good contrarian indicator. When investor sentiment becomes extreme in either direction, the trend reaches a point of exhaustion and reverses.
And finally, look where we are now…. another scary bearish cover. Its title is: “Don’t Get Mauled”, and it shows a bears claws ripping at the paper.
Are we near a temporary low? Or is it a final low? Time will tell.
But it does feel like it could be some sort of a low. That’s what the contrarian sentiment indicators suggest. When sentiment moves on mass to an extreme, maybe it’s time to take the opposite position.
Looking for the best ASX stocks to buy now?
Motion Trader‘s algorithms scan more than 2,000 ASX stocks daily in search of medium term investment trends. We then tell our members precisely when to buy shares. And most importantly, we tell them when to sell.
Try a no obligation FREE 14-day trial of Motion Trader, and see what an algorithmic trading approach could do for you.
Meet Jason

I'm Jason McIntosh, the creator of Motion Trader. My career began in 1991 on the trading floor at Bankers Trust. Nowadays, I trade my own systems from home in Sydney.
Motion Trader is for investors who value robust analysis, data driven entry and exit signals, commentary, and education. I use engineered algorithms to identify when to buy and sell ASX stocks. No biases or guesswork, just data driven signals.