When Will the Stock Market Bottom?
By Jason McIntosh | Published 20 June 2022
Many investors are asking when the stock market will bottom. While no one can say for sure, I’m going to show you 3 indicators that suggest the stock market may be close to turning around.
Let’s start with an interesting graph that came up on my Twitter feed during the week:
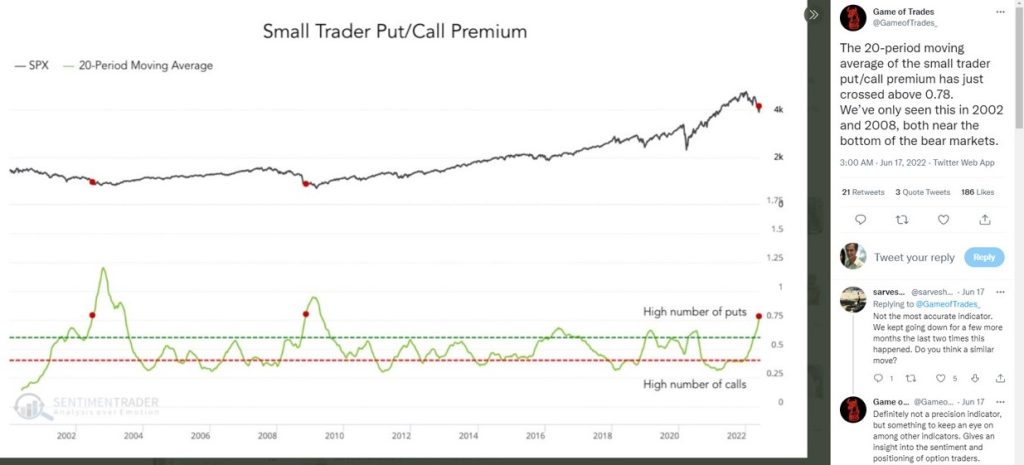
The lower portion of the graph shows the ratio of premiums for put and call options. It’s essentially the amount of money that small traders are paying to buy puts versus calls. At the top of the graph is the S&P 500.
When the ratio is low, small traders are aggressively buying call options. This means they are bullish about the S&P 500. And when the ratio is high (as it is now), there’s fear in the market. This is when they start buying a lot of put options, either as a speculation or as portfolio protection.
The ratio has recently hit 0.75. You’ll see two previous times this happened.
The first of these coincides with the S&P 500’s low in 2002 (which came after the Dot com bust and a recession in 2000). It was early. There was a bit more time before the final low. But it was very close — there wasn’t that much more downside. It was just more time.
Now look at the second time the ratio hit 0.75. This was in 2009 near the GFC low. Again, we can see that this ratio was rising. The final low was still several months away. But the ratio was close. It gave an early warning that a low was approaching.
The third time the indicator has triggered is now.
What does that mean?
Well, it doesn’t rule out the possibility of a capitulation sell-off. I believe we need to remain on alert for further selling. But it does suggest the S&P 500 is getting close to the point that it’s starting to get interesting.
The next graph I want to show you is fascinating. This is another item that turned up on my Twitter feed. It’s by J.P. Morgan and shows the University of Michigan consumer sentiment index going back to 1971. I love long-dated studies. They can provide some terrific insights.
Have a look at this:
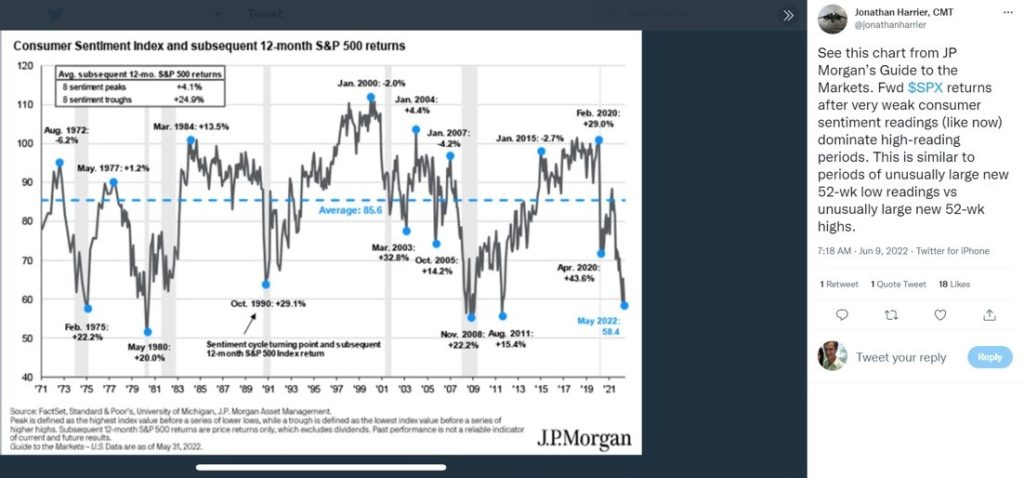
The graph highlights 12 significant peaks and troughs in the consumer sentiment index. It then shows the 12-month return in the S&P 500 from the respective points. The average market return from the eight significant troughs has been 24.9%. Interestingly, on the upside, average from the eight significant peaks has been 4.1%. The best returns generally occur when most people are pessimistic about the economy.
Is the latest reading in sentiment the low?
No one know for sure. While consumer sentiment is at historic lows, it could still get worst. We’ll only know the final turning point in hindsight. What we do know is that when consumer sentiment has bottomed in the past, it has led to strong stock market gains.
I have one more graph to show you. It also appeared on my Tweeter feed during the week. I thought was really interesting to look at. It’s another long-dated one. This one goes back to 1950. It’s some great research that looks at what’s called buying thrusts or market breadth.
Check this out:
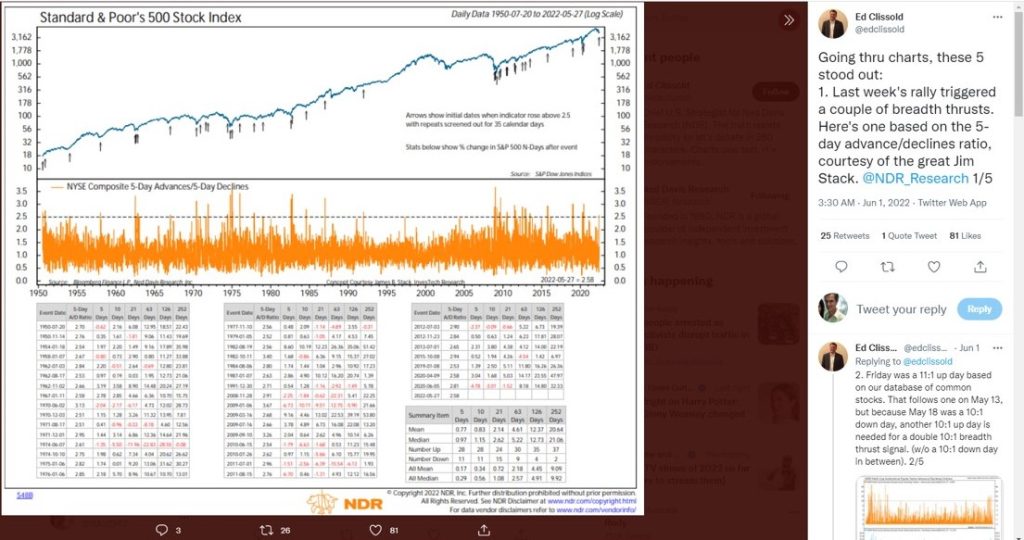
Now, have a look at the dotted line. This is when buying is 2.5 times more than selling over the period being measured. You’ll also see a series of arrows. These mark the points where buying exceeds selling by 2.5 times. And what is interesting is that a signal was triggered on 27 of May.
There have been 39 buying thrusts over the last 52 years. All but two of these have led to gains over the next 12 months. The two thrust that led to negative results only saw small losses. The average gain from all of these buying thrust arrows was 20% over the next 12 months.
The buying thrusts don’t pinpoint the low — the final low could still be several months away. But they have a good record of identifying where significant buying starts to come in and sentiment begins to change. It’s just going to be interesting to see how the latest signal plays out.
Looking for the best ASX stocks to buy now?
Motion Trader‘s algorithms scan more than 2,000 ASX stocks daily in search of medium term investment trends. We then tell our members precisely when to buy shares. And most importantly, we tell them when to sell.
Try a no obligation FREE 14-day trial of Motion Trader, and see what an algorithmic trading approach could do for you.
Meet Jason

I'm Jason McIntosh, the creator of Motion Trader. My career began in 1991 on the trading floor at Bankers Trust. Nowadays, I trade my own systems from home in Sydney.
Motion Trader is for investors who value robust analysis, data driven entry and exit signals, commentary, and education. I use engineered algorithms to identify when to buy and sell ASX stocks. No biases or guesswork, just data driven signals.