3 of the Best Sentiment Indicators (And What They Say Now)
By Jason McIntosh | Published 18 May 2022
Market sentiment indicators can provide a guide to where the stock market is heading next. And I believe these next 3 indicators are some of the best graphs for every trader to monitor.
Let’s update the current situation and what it means for the stock market.
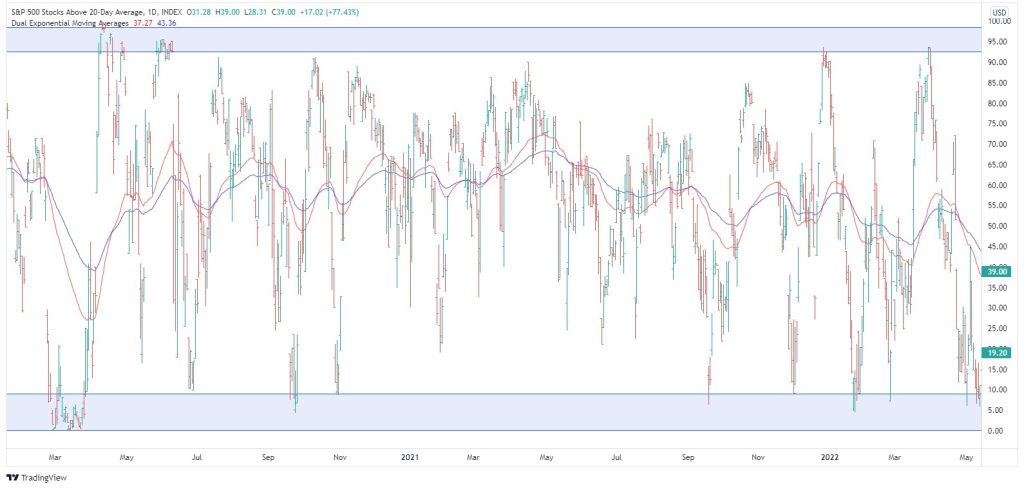
The first graph shows the number of stocks in the S&P 500 which are above their 20-day moving average. You can see that it’s pretty much at rock bottom. Currently, there’s 11% of stocks above their 20-day moving average. It’s been as low as 6% during the day, but this is about as low as this indicator gets.
Ordinarily, the indicator only briefly touches within the oversold zone before the market rebounds. This is one of the reasons why I think the recent sell-off is overstretch and that rebound is coming.
An exception would be if another COVID style crash was to occur. But I don’t think that’s the case because crashes typically don’t happen that close together. The COVID crash was only a couple of years ago. It’d be highly unusual to get two rapid crash-style events so close to one another. Anything can happen. But if we’re working on the balance of probability, I think the better play is that a short-term bounce is due.
Now let’s look at the number of stocks above their 50-day moving average.
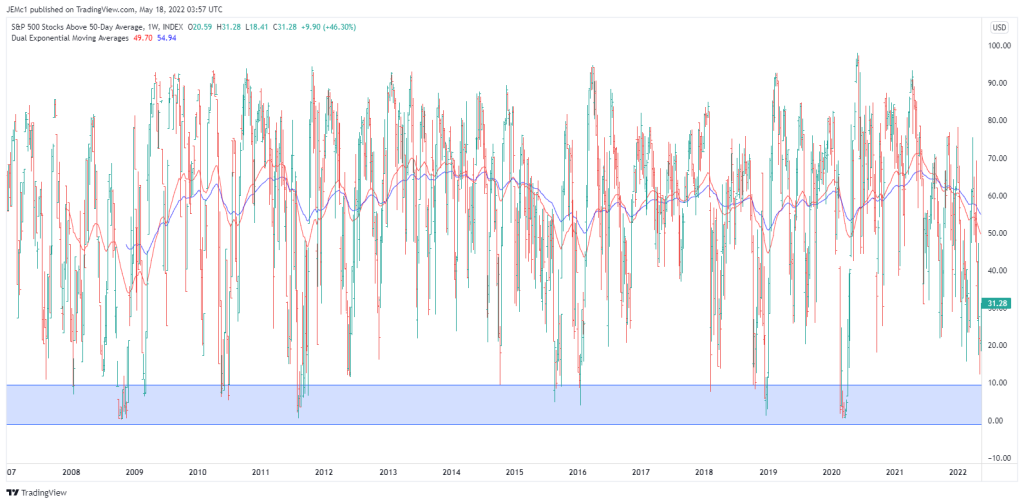
The number of stocks above their 50-day average continues to decline. But it’s still hasn’t got to an extreme. It’s fallen from around 24% down to 15%, but there’s still scope for it to go lower.
The above chart is a weekly that goes back to 2007. You can see the market come back to oversold territory every few years. We haven’t been down at an oversold extreme since COVID. And I believe there’s a high possibility we’ll get there before this correction is over.
One scenario which I think is possible is that we do get a bounce, or what’s called a mean reversion rally. It could last several days or several weeks. But after that, the market experiences another round of selling. Maybe it’s in the middle of the year.
This is just looking for possible courses the market could take. But if the S&P500 were to get a bounce, then it could potentially retest the recent lows later in the year. This could potentially be the event which brings the number of stocks that are above their 50-day moving average down to the extreme region. It’s from there that I believe we really start looking for a lasting low point. But I don’t think we’re there yet.
Lastly, here are the number of stocks above their 200-day moving average.
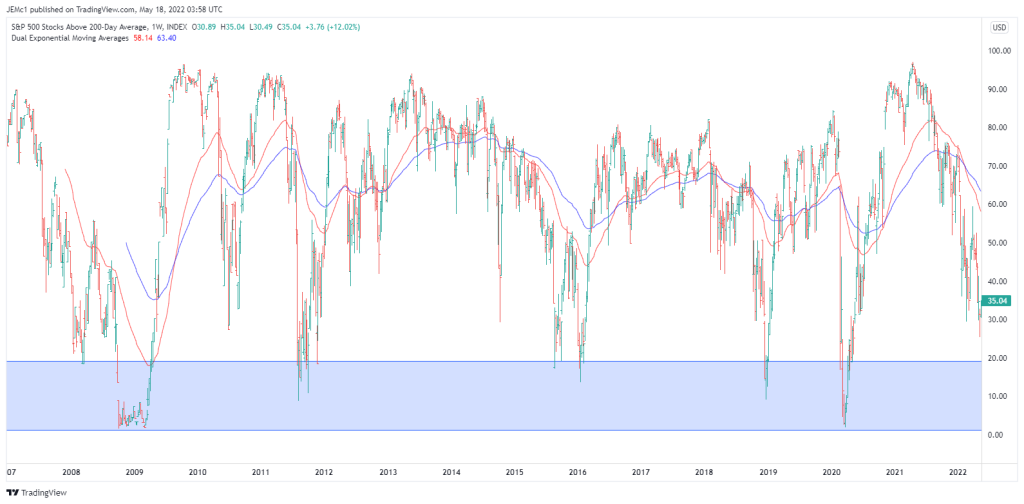
It’s a similar story to the 50-day average in that you can see the market does gets to extreme lows every few years. We’re getting close. I think the market will retest this region before this is all over. And once we’re in at region, then we really start looking closely for signs of a lasting low.
But again, I think it’s too early. I don’t think this is going to mark the end of this current corrective/bearish phase. I think there’s more in it, although from a short-term perspective, maybe there’s some sort of reprieve before potentially dipping into this level in the weeks or maybe the months ahead. Time will tell.
I’m not looking to buy into any potential rally over the next few weeks. I believe that any counter-trend rally is likely to only last a relatively short period of time. I believe we need to remain defensive for now. Bullish conditions will once again return. But I don’t think that time has come.
Looking for the best ASX stocks to buy now?
Motion Trader‘s algorithms scan more than 2,000 ASX stocks daily in search of medium term investment trends. We then tell our members precisely when to buy shares. And most importantly, we tell them when to sell.
Try a no obligation FREE 14-day trial of Motion Trader, and see what an algorithmic trading approach could do for you.
Meet Jason

I'm Jason McIntosh, the creator of Motion Trader. My career began in 1991 on the trading floor at Bankers Trust. Nowadays, I trade my own systems from home in Sydney.
Motion Trader is for investors who value robust analysis, data driven entry and exit signals, commentary, and education. I use engineered algorithms to identify when to buy and sell ASX stocks. No biases or guesswork, just data driven signals.