When is the Best Time to Sell Shares?
By Jason McIntosh | Published 5 May 2022
People are always asking me: when is the best time to sell a stock? It’s a question everyone needs to be able to answer if they are to find success as a trader or investor.
I sold one of the best-performing stocks in my portfolio last week. It’s just a good example of how I let profits run, sit through corrections, and eventually sell a winning stock.
Have a look at this chart:
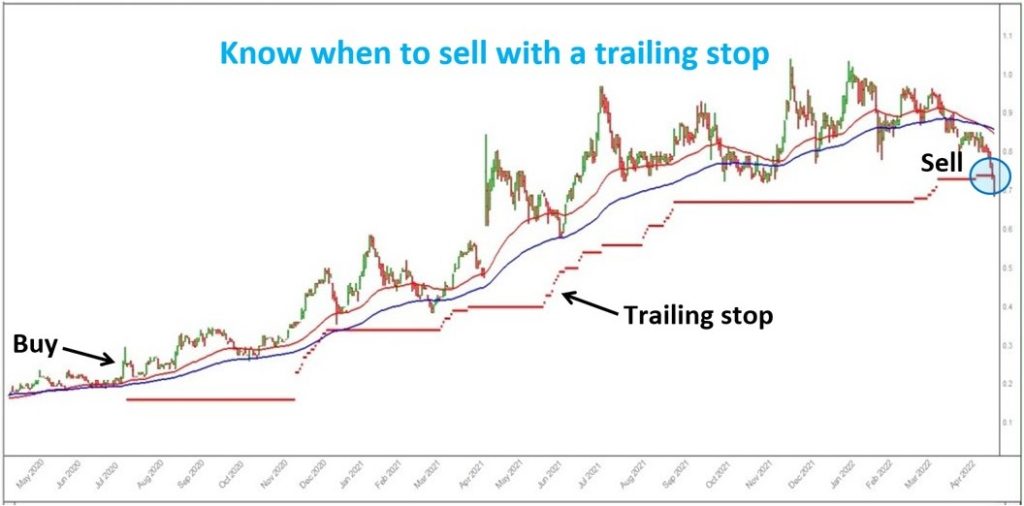
The company’s name is Universal Biosensors [ASX:UBI]. I bought the stock in July 2020 just after the 50 and 100-day moving averages had turned higher. The shares were also trading at 70-day high, which is another one of my entry criteria — my strategy involves buying into strength.
Now, have a look at the red line below the share price. It looks a bit like a rising staircase. That’s my trailing stop loss. It rises as the shares trend higher. I’ll stay in the position until the stock peaks and then falls back to the trailing stop.
You notice that I the trailing stop is typically a long way below the share price. My strategy is to give a stock lots of room to move. And the reason I give them so much move is because just about every trend has pullbacks and corrections along the way.
Take UBI for instance, there were seven pullbacks of more than 20%. If I had a close trailing stop, I would have been stopped out of my position soon after buying. But by giving the stock plenty of breathing space, I’ve been able to stay on a big trend. The result is a profit of over 170% in under two years.
UBI is also a stock from my Motion Trader subscription service. Many of members who would have been buying at the same time running the same trailing stop (Motion Trader calculates a trailing stop for each trade).
It’s interesting to look at all the corrections on the chart. Many people sell their shares during these periods. The worry the trend is over and sell unnecessarily. But the wide trailing stop kept me in. It started to tighten up near the end of the trade, and when it hit the red line, I sold my shares.
You see, the trailing stop is like my line in the sand. I’ll patiently sit through a series of corrections and give the stock ample room to move. But when it hits the stop, I’m out. I’ll sell the shares and move onto the next trade.
Maybe UBI bottoms near where I sold and bounces back. But the risk is that it doesn’t… the risk is that it continues to fall away. It’s interesting to note that the moving averages are now turning lower. I believe this makes the shares vulnerable. The risk of holding is now too high for my trading style.
I’ve seen so many people hold onto stocks like this after the trend turns lower. And over the course of a year or so, they give back all their gains. It happens so often, so that’s why the exit strategy is so important, and that’s why I use these wide trailing stops.
There are various way to determine a trailing stop. My trailing stops are automatically calculated by my system software. I use an algorithm through my Motion Trader subscription service calculate the trailing stops across my portfolio. I’m using average trading ranges as a key component in the calculation. This means the width of the stop will vary with a stock’s volatility.
Other methods include percentage based training stops, and discretionary levels set off support and retracement zones. No matter how you calculate a trailing stop, I believe they are a crucial tool for every trader and investor.
So that’s how I determine when to sell a stock. My trailing stops are clinical and clear-cut. And they can make the difference between a triple digit gain and a trade with little to show for itself. UBI is a case in point, thanks to a calculated exit strategy, I now have a 170% in the bank.
One last point, it’s interesting that most people have probably never heard of Universal Biosensors. I know I certainly hadn’t when I got the signal. And that’s a great thing about algorithms. They not only tell you when to get out, they also find the stocks that few people have heard of.
Looking for the best ASX stocks to buy now?
Motion Trader‘s algorithms scan more than 2,000 ASX stocks daily in search of medium term investment trends. We then tell our members precisely when to buy shares. And most importantly, we tell them when to sell.
Try a no obligation FREE 14-day trial of Motion Trader, and see what an algorithmic trading approach could do for you.
Meet Jason

I'm Jason McIntosh, the creator of Motion Trader. My career began in 1991 on the trading floor at Bankers Trust. Nowadays, I trade my own systems from home in Sydney.
Motion Trader is for investors who value robust analysis, data driven entry and exit signals, commentary, and education. I use engineered algorithms to identify when to buy and sell ASX stocks. No biases or guesswork, just data driven signals.