Market Sentiment Hit a 30-Year Low

By Jason McIntosh | Published 6 May 2022
One of the big drivers of the stock market is sentiment. And sentiment just hit its lowest level in 30 years. I’m going to show you a fascinating graph I saw through the week, it shows how negative investors are about the market.
Check this out:
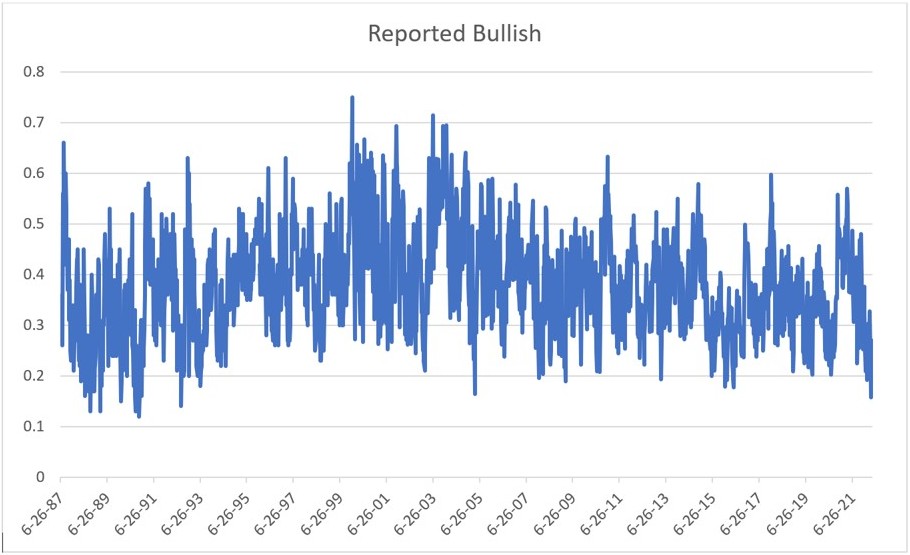
I’ve prepared this graph with data from the American Association of Individual Investors. You can get this data yourself from their website. It’s from a weekly survey of investors, and the data goes back to 1987.
I love these long data series. It’s fascinating look for patterns and see how they play out. And what really gets my attention on this chart is that at the end of April, the bullish percentage of investors fell to 16.4%. If you look back over all these periods, it’s the lowest level since April 1992.
I think this is quite extraordinary. It’s lower than during COVID, lower than the GFC, lower than the tech bust. It’s had a small bounce off the low in the past few days, but it’s still at extreme levels.
The lows in the bullish percentage reading doesn’t always match up with market lows. Sometimes these lows occur when the market might be at a record high and starts to pull back. At other times it occurs after a big fall. But when you couple this information with other data, it can be a useful contrarian indicator.
Another sentiment indictor is the number of S&P 500 stocks above their 20-day moving average.
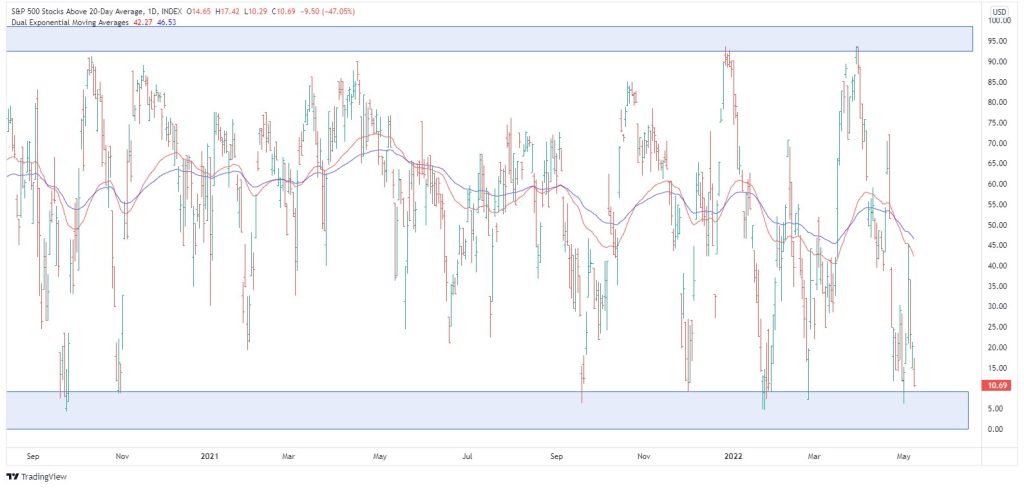
After the market’s 12% rally in March, the percentage of stocks above their 20-day moving average was at a very high level. At that point, I said that a pullback of at least 5% was likely. We got that, plus some.
What’s happened now is that this indicator has flipped. The number of stocks above their 20-day moving average is come all the way back down to the point where it’s at an extreme low. And these extremes levels often produce a bounce.
If we do see a bounce, I don’t expect a new bull market… just a bounce within a bear market.
Let me show you why:
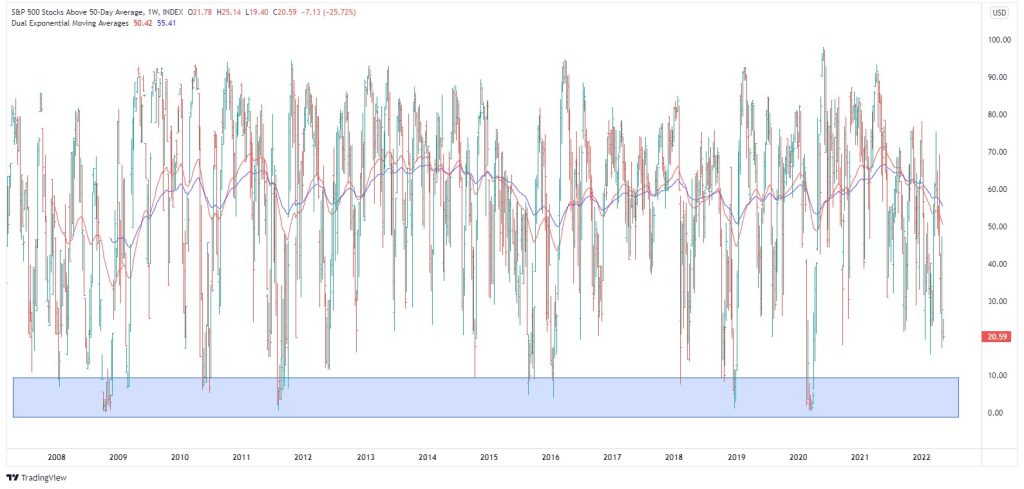
This a weekly graph showing the number of stocks above their 50-day moving average. It’s interesting when you look at this series on a weekly chart. So, we’re currently at 30%. We’ve been down as low as 16% recently. That may seem low, but there are several readings below 10%, so I think this does have the potential.
And this is another reason I think this correction still has further run, because I think the market may need to test down towards this 10% of stocks above their 50-day moving averages before we can really start saying the correction has run its course.
We can also then look at the stocks above their 200-day moving average.
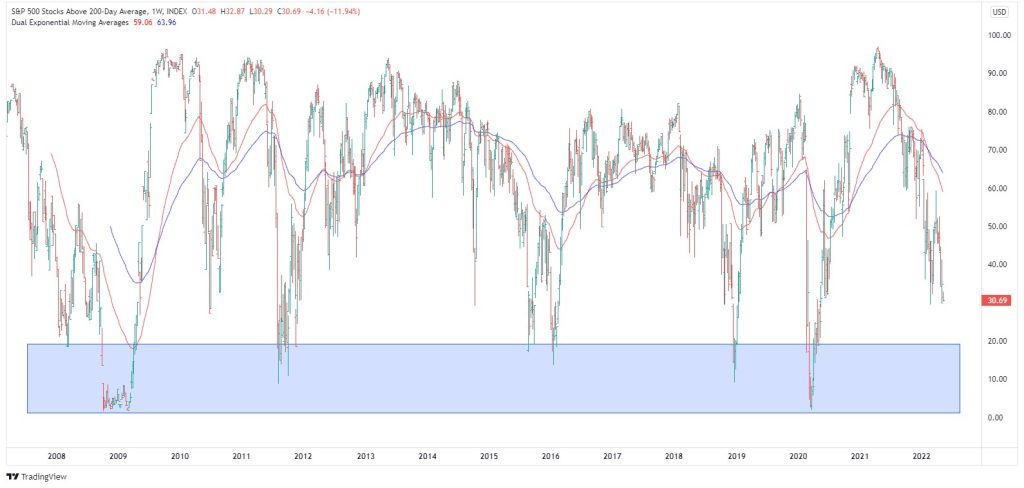
And it’s the same thing. It currently at 36%, and has been down as low as 29%. But other extremes have tested below 20%. So, again, I believe this correction may still have further run.
Looking for the best ASX stocks to buy now?
Motion Trader‘s algorithms scan more than 2,000 ASX stocks daily in search of medium term investment trends. We then tell our members precisely when to buy shares. And most importantly, we tell them when to sell.
Try a no obligation FREE 14-day trial of Motion Trader, and see what an algorithmic trading approach could do for you.
Meet Jason

I'm Jason McIntosh, the creator of Motion Trader. My career began in 1991 on the trading floor at Bankers Trust. Nowadays, I trade my own systems from home in Sydney.
Motion Trader is for investors who value robust analysis, data driven entry and exit signals, commentary, and education. I use engineered algorithms to identify when to buy and sell ASX stocks. No biases or guesswork, just data driven signals.