
Our Investment Process

By Jason McIntosh | Founder, Motion Trader
Is simplicity the key to financial success?
Could an easy to understand process really be the answer?
Many will scoff at this thought. They’ll say simplicity is for novices. In their view, elaborate strategies and exotic products are the only way to make big money.
Sure, financial markets are becoming ever more complex. The days when you’d phone your broker to buy a few blue-chip shares are a fading memory for many.
But a straightforward approach is still worth considering.
Have a read of this:
"Never underrate the majesty of simplicity as a long-term strategy for productive investing. Simplicity, indeed, is the master key to financial success."
John Bogle, Founder of Vanguard
John Bogle is a pioneer. He made wealth strategies affordable to just about everyone. This was at a time when Wall Street was charging big dollars for ordinary returns.
Vanguard’s strength is its simplicity. The firm doesn’t rely on analysts like traditional funds. Its aim is to “simply” replicate an index. Investors benefit from lower fees and market performance.
And do you know what?
It works…
Vanguard manages over $4 trillion and is the world’s second largest fund manager. “Keeping it simple” has made the company one of the biggest success stories in history.
The US Navy has a name for this approach — the KISS principle, or keep it simple, stupid.
The theory says that simple systems are better than complex ones. That’s because fewer moving parts makes them less prone to failure.
This same logic applies to trading…
Simple strategies often beat their fancy cousins. I’ve seen some of the most complex “black box” systems fail spectacularly, while simpler strategies often thrive.
So why choose complicity at all?
An everyday misconception
Well, many people believe it’s clever to be complex.
Simplicity on the other hand is often seen as inferior, or even worse, unintelligent.
But that’s a mistake in my view.
You see, simplicity requires the clearest of thinking. It involves identifying the core elements of a problem and working out an efficient solution. And that can be hard to do.
Motion Trader combines both complexity and simplicity.
The system’s framework is unavoidably complex. It involves lots of computer code to deal with millions of pieces of data — there’s no getting around this.
But the strategy itself is straightforward.
In fact, my kids understand the concept. And that’s how it should be.
Let me describe Motion Trader in two sentences:
The strategy is to buy stocks that are rising and avoid (or short) stocks that are falling. It’s then a matter of cutting losses early and letting profits run for as long as possible.
That’s how it works. 
I call this “elegant simplicity”.
So how does the strategy stack up?
Well, first let me explain what you’re going to see…
The following performance is from back-testing. This is a process that uses historical data to simulate what could have happened. The results are entirely hypothetical.
Back-testing is a practice that many professional traders use. It allows them to test strategies without placing real trades. This helps them evaluate strategies relatively quickly.
But it comes with limitations…
Unlike a real performance record, simulated results don’t represent actual trading. This is because the trades have not been executed and exclude factors such as a lack of liquidity.
Simulated trading programs are also subject to the potential of hindsight bias. This is where you create trading rules to suite the conditions. And these conditions may not repeat in the future.
No representation is being made that any account will or is likely to achieve results like you’re about to see. And you should not consider these results as typical.
Lastly, back-testing is not a crystal ball to the future. It shows what could have happened in the past if we used a certain strategy… not what will happen in the future.
With all the said, here’s a chart of the All Ordinaries over a 21-year period (1999 to 2020):
Now, that’s a chart.
The period contains booms, busts, bullish rallies, bearish sell-offs, and grinding inaction. It also contains two of the worst periods for investors — the Dotcom crash and the GFC.
In total, there are 15 up years, six down years, and one which was essentially flat.
You could say that this period in history has seen it all.
The All Ords begins the period at 2,813.4 and finishes at 6,850.6… a gain of 143.5%. This delivers a compound annual growth rate of just 4.3% (this excludes dividends).
With the backdrop set, here’s how Motion Trader handles the period: 
This is the Motion Trader’s hypothetical performance. It assumes placing $1,000 on every buy signal the algorithms identify, and there’s no allowance for costs or dividends.
While the All Ordinaries finishes the period near its 2007 peak, Motion Trader’s hypothetical profits have made a series of new highs.
Have a close look at the two charts…
While the graphs generally tend to rise and fall at around the same time, Motion Trader often does better when the market rises, and not as bad when it falls.
Over a few years, small daily differences can really add up.
So, what is driving Motion Trader’s performance?
Well, it’s rather straightforward…
Motion Trader’s hypothetical portfolio has a strong stock bias. The system buys and holds stocks that are rising. It then sells when a stock’s upward run appears to be over.
I call this “simplicity in motion”.
Remember John Bogle’s words:
“Never underrate the majesty of simplicity as a long-term strategy for productive investing. Simplicity, indeed, is the master key to financial success.”
That’s what Motion Trader is all about.
The system uses a strategy that almost anyone can grasp. It then applies this process to over 2,000 ASX listings. And the overall results from back-testing are positive.
Winning the flag
Think of it in footy terms. The best teams have rock solid defence AND a robust attack. One without the other won’t win your club the premiership.
Motion Trader has a solid defensive game. Every trade has an exit stop. This helps gets you out when the trend changes. It’s clear-cut and unemotional. Capital preservation is critical.
But that’s just half of the story…
Motion Trader also plays good offence. The system identifies stocks that are rising and then lets profits run. This is the key to potentially making big double and triple digit gains.
Ask yourself: How is this different to the way many people manage their portfolio?
I’m sure you know the answer.
Many people do the opposite — they let losses run and they cut profitable investments early. This is the financial equivalent of having a weak defensive line and poor attack.
And just like on the footy field, it rarely ends well.
Behind the curtain
Chances are you like the look of Motion Trader’s back-testing.
But like first impressions, they don’t tell you everything.
You need to dig deeper to get the full picture.
I’m now going to explain some of the data behind the chart. I want you to see how the system works. And I want you to better understand what drives the results.
Yes, it’s good to know a strategy is profitable.
But to maximise your benefit, I believe it pays to know “why”.
You see, understanding is a key factor in using any system successfully. Simply knowing what to expect can make the difference between sticking with it or giving up.
I know from experience that I couldn’t trade a system I didn’t understand. The uncertainty would be unbearable. That’s why I make Motion Trader so transparent.
My confidence also gets a boost when I know what’s going on. I imagine you’re no different.
Hopefully, these insights boost your trust in the system.
Here are the numbers behinds the performance graph: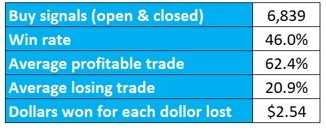
The table covers the period of 1 January 1999 to 31 December 2020. It includes every buy signal during those 21 years. There’s no allowance for costs or dividends.
Okay, let's start with the "strike-rate". This refers to the percentage trades that are profitable. For example, if two out of four trades make money, the strike-rate is 50%.
People regularly ask me about this topic. They often believe a system’s success is defined by how many winning trades it signals — the higher the strike rate, the better.
And I can understand why…
Being right is critical in many professions. For example, no one wants their doctor, pilot or accountant to only be right some of the time.
But trading is different.
You see, trading isn’t about being right, it’s about making money.
The need to be right is a big reason many traders fail. They take lots of small profit and hold onto a few big losses. Sure, their strike rate looks good, but they still lose money overall.
Quite simply, they’re focusing on the wrong performance measure.
The question you should consider is this: Do you want to be right, or make money?
In the words of George Soros — one of the greatest traders of all time:
"It's not whether you're right or wrong that's important, but how much money you make when you're right and how much you lose when you're wrong."
So how does Motion Trader’s strike rate stack-up?
Well, between 1 January 1999 and 31 December 2020, the figure is 46%.
As I said, strike rates are not the main concern for many professional traders. The aim is to make money. And being right all the time is often counter-productive.
They say you never go broke making a profit. Well, this isn’t always true.
Here’s an example…
Say you buy 10 stocks. You aren’t greedy, and quickly lock in lots of small profits.
Your average profitable trade is 5%.
Now, if your first nine trades are winners, you’ll be up a total of 45% (9 trades x 5% per trade).
But what about that one loss?
While you’re quick to take profits, you tend to hold onto losing stocks. This is a common mistake that can potentially lead to large losses.
"...strike rates are often a poor predictor of real success."
Despite having a seemingly impressive 90% win rate, it only takes one bad trade to wipeout all the gains. That’s why strike rates are often a poor predictor of real success.
Motion Trader does the opposite to this. It runs winners and cuts losses.
This impatience with losses pulls down the strike rate.
Motion Trader could give losing stocks more time to turnaround, and potentially improve the strike rate. But that not the goal. The system’s aim is to maximise total returns.
Understanding this principle could make a huge difference to your results.
Remember, there’s nothing wrong with a number of relatively small losses. That’s all part of the strategy. A few big winners could pay for these many times over.
So what do Motion Trader’s hypothetical returns look like?
Well, between 1999 and 2020, the average winning trade was up 62.4%.
On the flipside, the average losing trade was down 20.9%.
That makes the average profit 2.99 times large than the average loss. This is what could happen when you use a strategy that runs profits run and cuts losses.
Motion Trader’s strategy is to identify stocks that are rising. It’s then a case of maximising profits by letting winners run and using a stop loss to minimise losses.
On average, Motion Trader made a hypothetical $2.54 for every dollar its lost.
Motion Trader’s results are largely due to buying into strength. This automatically excludes stocks that are falling from entering the portfolio. And this could make a big difference.
You see, Motion Trader is cherry picking.
The aim is to only buy strong stocks, while avoiding those that are pulling the market lower.
It’s a case of buying what’s rising and sidestepping what’s not.
Here’s a hypothetical example:
This is the share price chart for investment manager Navigator Global Ltd [ASX:NGI].
Now, have a look at the entry level.
You’ll notice that Motion Trader signals a buy as the shares are rising. The aim is to trade with the trend, not against it. This helps put the odds of success in your favour.
But a good entry isn’t enough. The next step is to stay on the trend.
And this is where Motion Trader’s trailing stop kicks in.
You see, it’s your strategy to sell that determines how much you make or lose. Getting this right is the key to potentially making a big double or triple digit gain.
Now, have a look at the red line below the share price… this is the trailing stop.
If you don’t know, a trailing stop is the exit point. The strategy is to stay in the trade until the shares hit the stop. You then close the trade and hopefully bank a profit.
Motion Trader’s algorithms calculate a unique level for each trade. This removes the guesswork and gut feel from selling. The strategy could help you exit each trade with consistency.
This isn’t to say every signal will be a winner — some stocks will fall in value.
And Motion Trader has a plan for that too.
Check this out:
This is a chart for Australian Agricultural Co. Ltd [ASX:AAC].
As I’ve said, Motion Trader’s strategy involves buying into strength. Probability favours that a rising trend should continue to rise — the path of least resistance is up.
But while this tactic may improve the odds of success, it’s no guarantee.
You see, good trading deals in probability, not certainty.
That’s why an exit plan is so important.
Motion Trader’s sets a stop-loss for every trade. Think of this as a “line in the sand”. It’s the point where you accept a trade isn’t working, and you sell. The aim is to minimise your loss.
Many traders don’t sell their losing trades when they should. Instead, they keep holding in the hope a losing trade will recover. But this can be an expensive decision.
In my experience, a strategy to exit losing trades is essential.
So, will Motion Trader work for you?
I honestly don’t know.
Trading is an uncertain pursuit. A good system could improve your chances of success. But there’ll still be times when trading is difficult — no matter what your approach.
This style of trading also isn’t for everyone…
Some people aren’t comfortable letting profits run. Others ignore the exit signals. While a few people have several losing trades and give up on the system.
But I do know that Motion Trader has made a positive impact for many. Whether it’s been from following the signals or improving their trading skills, it’s rewarding to hear their stories.
You can read some of their experiences here.
The final point I’ll make is about time…
Motion Trader is a medium-term system that aims to profit from large share price moves. These often take months, if not years. You should not expect to make a fortune overnight.
If you’re still interest, then I’d love to hear from you.
I truly believe that I can help you build a market beating portfolio.
All the best,
The material on this website is general in nature. It does not constitute personal investment advice or personal trading advice. Any advice provided is general advice only and does not take into account an individual’s risk profile or financial situation. Trading involves the risk of loss as well as the potential of profit. You should seek independent financial advice in deciding if trading is appropriate for you. As always, past performance is not indicative of future performance. Please click here for our Financial Services Guide. Jason McIntosh is an Authorised Representative (AR No. 1274211) and Motion Trader Pty Ltd is a Corporate Authorised Representative (CAR No. 1274210) of Shartru Wealth Management Pty Ltd ABN 46 158 536 871, AFSL 422409.
and/or Jason's personal share portfolio.

Meet Jason
I'm Jason McIntosh, the founder of Motion Trader. My career began in 1991 on the trading floor at Bankers Trust. Nowadays, I trade my own systems from home in Sydney.
Motion Trader is for investors who value robust analysis, data driven entry and exit signals, commentary, and education. I use engineered algorithms to identify when to buy and sell ASX stocks. No biases or guesswork, just data driven signals.
