Don’t Get Caught in a Bear Market Frenzy

By Jason McIntosh | Published 29 June 2022
It’s easy to get caught up in the negative frenzy during bear markets. While I believe it’s important to understand the risks — that’s what I’ve been outlining my weekly stock market videos — we shouldn’t be so focused on bearish scenarios that we overlook potential positives.
Have a look at this graph:
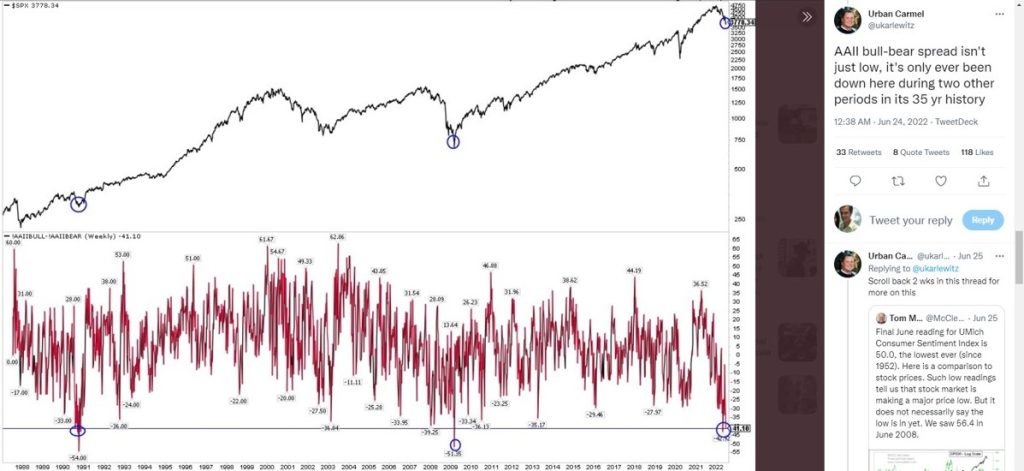
This turned up in my Twitter feed through the week. I just love these long-dated data series. It goes back to 1987. You can see the 1987 stock market crash near the start of the chart.
Long-dated series are great because they include many different stock market cycles. It’s not just about what’s happened over the last three or four years. It’s looking at a range of cycles and conditions, and that can help give you a better understanding of the possibilities moving forward.
The graph shows the American Association of Individual Investors (AAII) survey results. When the readings are high, investors are overwhelmingly bullish. And they are overwhelmingly bearish when the reading is low.
Look at where the indicator is now. It’s near the lowest level since the AAII started recording the data. And it’s only the third time the indicator has hit the blue line. The last time it was this low was during the GFC. Prior to that was in 1990.
The latest reading is lower during the other Dotcom bust. And you can see that previous extremes in negativity it marked a low point in the S&P 500. The stock market then went on to ultimately make new highs.
Overly negative sentiment often leads to a period of strong prices. So, this is a positive that’s presently developing in the market. It doesn’t tell us where a final low is going to be. But it tells us that we’re in the territory of where final lows can be made.
I’m going to tell you about another positive I’m seeing. Some of the market breadth indicators are now starting to rebound. Have a look at this. It’s the number of stocks above their 20-day moving average.
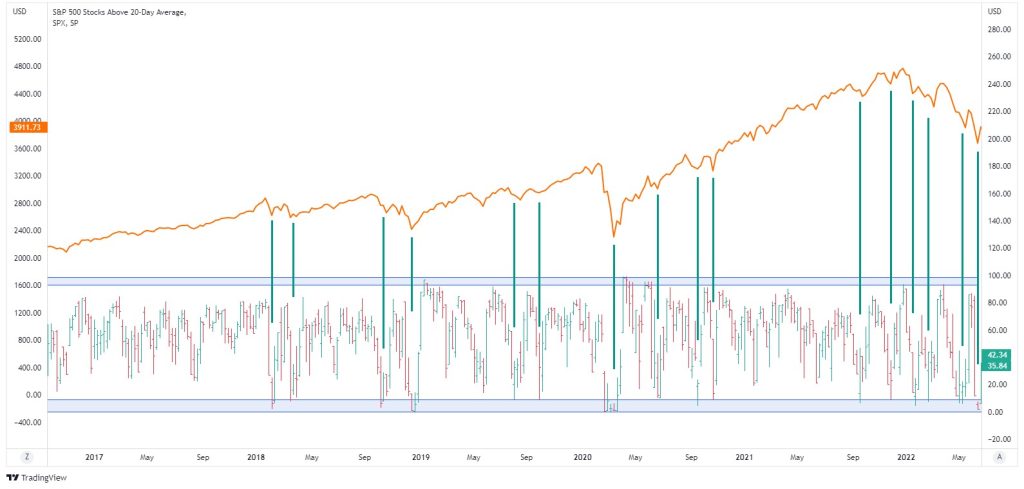
You can see that the indicator is starting to rebound. I’ve also overlayed the graph with the S&P 500. Look at the low points. They follow periods when the stock market was falling, and almost no stocks were above their 20-day moving average.
Every time the market gets down to an extreme, we see a notable bounce in the S&P 500. It can either be a lasting low or it can be a temporary low before further declines. But they all coincide with some sort of a low in the stock market. I’ve used this indicator to help identify the March and May rallies.
The number of stocks above their 20-day moving average is starting to rebound from extremely low levels. This is a potential positive. If we continue to see this indicator of market breadth improve, that will likely see a continued rally in the S&P 500. This would be a key factor in breaking the current sell cycle.
None of this indicates that a final low is in place. But it helps lower the risk of a capitulation selloff. As I said last week, aspects of this selloff are unprecedented. So, we shouldn’t overestimate our ability to predict how this is going to play out.
But by understanding some of the potential scenarios, I hope you’re in a better position to make less emotional decisions. Emotional decisions cost so many people, so much money, particularly in these periods. My aim is to provide you with analyses that gives you a framework for the uncertainty.
Looking for the best ASX stocks to buy now?
Motion Trader‘s algorithms scan more than 2,000 ASX stocks daily in search of medium term investment trends. We then tell our members precisely when to buy shares. And most importantly, we tell them when to sell.
Try a no obligation FREE 14-day trial of Motion Trader, and see what an algorithmic trading approach could do for you.
Meet Jason

I'm Jason McIntosh, the creator of Motion Trader. My career began in 1991 on the trading floor at Bankers Trust. Nowadays, I trade my own systems from home in Sydney.
Motion Trader is for investors who value robust analysis, data driven entry and exit signals, commentary, and education. I use engineered algorithms to identify when to buy and sell ASX stocks. No biases or guesswork, just data driven signals.