Indicator Points to Stock Market Bottom

By Jason McIntosh | Published 26 August 2022
Could the stock market be bottoming? Many people say it’s not. Instead, they believe the SP500 will crash in 2022. But I’m going to show you an indicator that suggests an important low may already be in place. It turns out that the June/July advance could be more than a bear market rally.
Have a look at this chart:
Okay, let me explain what’s happening.
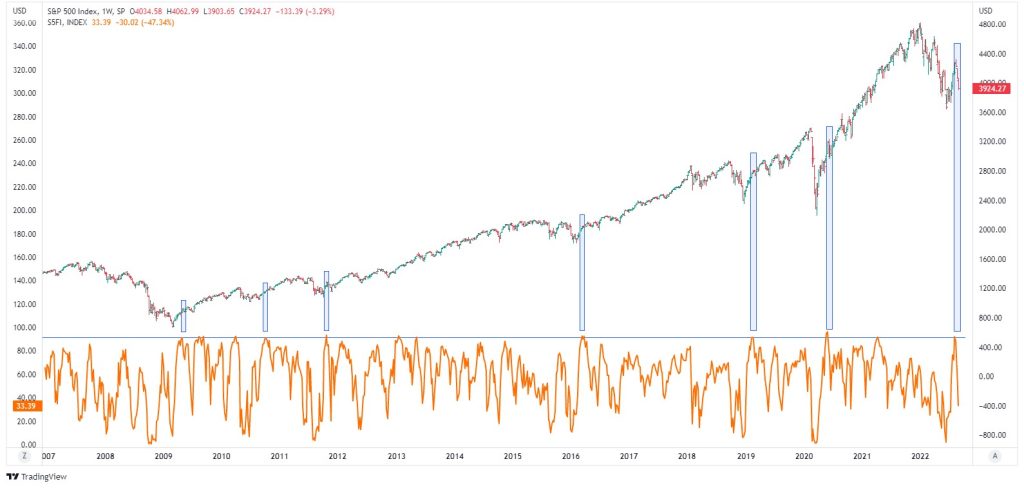
This is the S&P 500 on a weekly chart going back to 2007. Below the S&P 500 is an indicator that shows the number of S&P 500 stocks trading above their 50-day moving average.
Many people believe that the market must be due for a fall when a lot of stocks are above their 50-day moving average. And while that can be true in the near term, it’s not necessarily the case from a bigger picture perspective.
You see, when many stocks are above their 50-day moving average, it’s a sign that a rally is being supported by a lot of stocks. And when this is the case, we say that market breath is strong, which is often a bullish sign.
Now, you’ll see a horizontal blue line near the top of the indicator. This represents 90%. When the indicator hits the line, 90% of S&P 500 stocks are above their 50-day moving average. And you can see the market gets up there reasonably frequently. It might be a couple of times a year or thereabouts.
The next thing to note is that I haven’t highlighted all of the times the indicator hits the blue line. Rather, I’ve only marked are ones where the number of stocks hits 90% after a significant fall (i.e. a fall of, say 15%, or more). Many of the hits are after a minor pullback. I’m not so much interested at those. I’m not looking at ones where the indicator hits 90% after a significant fall.
Now, have a look at how the indicator performed through the GFC (far left of chart in 2007/08). There were several large bear market rallies of 20% or more. But the number of stocks above their 50-day moving average never got to 90%. Those bear market rallies didn’t have a significant breadth to them. In other words, the rallies weren’t broad based. They were in a select group of stocks.
But look what happened in 2009. The S&P had an initial move higher, and the number of stocks above the 50-day moving average hit 90%. That indicated strong market breadth, which was a sign of a market recovery.
Similar thing happened after the other selloffs highlighted on the graph. Each period involved a significant decline. The rallies off the lows were paired with broad participation across from across the S&P 500. As soon as the number of stocks above their 50-day moving average hit 90%, it was a sign that the upward trend was resuming. On each occasion, a sustained recovery followed market breath hitting 90%.
Now, look at what’s happening in August 2022. The number of stocks above their 50-day moving average has just hit 90%. Time will tell if this leads to a sustainable recovery. But it often pays to keep an open mind.
Many people are adamant the June/July advance is bear market rally. And maybe it is. But there is some evidence to suggest that may not be the case. That’s why I say keep an open mind. Success in the markets often requires flexible thinking and an openness to alternative possibilities.
Looking for the best ASX stocks to buy now?
Motion Trader‘s algorithms scan more than 2,000 ASX stocks daily in search of medium term investment trends. We then tell our members precisely when to buy shares. And most importantly, we tell them when to sell.
Try a no obligation FREE 14-day trial of Motion Trader, and see what an algorithmic trading approach could do for you.
Meet Jason

I'm Jason McIntosh, the creator of Motion Trader. My career began in 1991 on the trading floor at Bankers Trust. Nowadays, I trade my own systems from home in Sydney.
Motion Trader is for investors who value robust analysis, data driven entry and exit signals, commentary, and education. I use engineered algorithms to identify when to buy and sell ASX stocks. No biases or guesswork, just data driven signals.