3 Trailing Stop Strategies (And How to Use Them Yourself)

By Jason McIntosh | Published 2 July 2021
Trailing stop strategies give your trades a clear-cut exit point. A trailing stop loss can help you maximise profit and manage risk. This interview with Jason McIntosh appeared on the Ausbiz financial news channel.
Host: How do you know when to sell shares?
To take us through it, Jason McIntosh from Motion Trader joins me live in the studio. Jason, thanks so much for joining me this afternoon on The Trade. Everyone is so focused on when to buy. But of course, selling is so important, isn’t it?
Jason: It’s interesting Kara. People are always looking at when to buy shares. And yes, buying is important. But there’s something which is just as important, if not a little bit more important, and that’s when to sell shares. I think for a lot of people, selling is an afterthought. But when you think through the process, you don’t make your money when you buy shares, you make it when you sell shares. So that’s why it’s just so critical to get it right.
I’ll tell you this fascinating story from early in my career. I started off on the foreign exchange desk of a global investment bank. It was 1993 and I was the junior trader on the desk. My job was working the night shift. But on Friday afternoons, I’d come in early, meet up with the day team, and then go into the night shift.
So I came into the dealing room one Friday afternoon, it was around four o’clock and the trading desk was unusually quiet. And this was odd because trading desks are typically boisterous places full of activity. So I sat down and looked across to one of the senior traders I worked with, and asked “what’s going on?”. She said, log into the spot Aussie book and have a look.
So I log in and there’s a $100 million position with a million dollar loss. And remember, this is back in 1993, it’s 28 years ago. Even by today’s standards, that’s pretty ugly. But back then it was a shocker. You see, we had this new spot guy join the desk. He’d come across from another investment bank. I guess he wanted to make an impact, and he certainly did that.
I saw your interview with Nick Leeson a couple of weeks ago, and it’s exactly the same sort of story. It’s all about an overconfident trader who wouldn’t cut a relatively small loss early, adding to a losing position in the hope that it bounces back, and then ultimately losing control. This is a classic story which is typical of many professionals and retail traders alike. That’s why you’re selling strategy is so critical. You need to understand it, implement it, and get it right.
Host: So then how do you decide when to sell?
Jason: There are two elements that I think people really need to understand. Firstly, you need a strategy for when to sell a losing trade, and secondly, you need to know when to sell a profitable trade. They’re both similar, but they’re different. I’ll just focus on the profitable side today, as they’re both big topics in their own right.
Now, a problem for many people is that they get a small to moderate profit, maybe it’s 10%, 20%, or 30%, and the emotions kick in. They don’t want to risk giving back any of it, so they sell. But if you’re always taking moderate profits. You can never get a really big profit. You can never get the 100% plus gains. So the challenge to be successful is to turn those moderate profits into big profits, and the best way I’ve found to do that, and to manage risk at the same time, is to use a trailing stop strategy.
If you don’t know, a trailing stop is simply an exit level that trails below a rising share price. When a stock eventually peaks and rolls over, it will hit the trailing stop and you sell. You know where you’re getting out every time. It then a case of moving onto the next trade. It brings some certainty to an uncertain world of equity investing.
Host: So when you’re using those trailing stops, what are you looking at? Percentage pullbacks? What type of trailing are you looking at?
Jason: There are three main types of trailing stops. The first type is how I started my career. I call it the discretionary trailing stop. Here’s an example of how I’d manage this strategy:
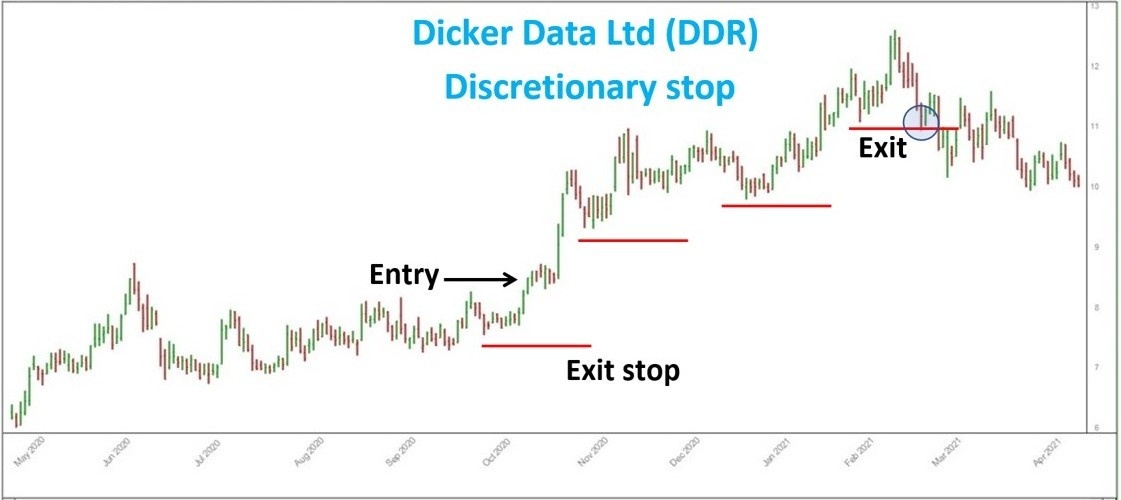
You’ll see I’ve marked a hypothetical entry point. This is the type of breakout I’d look for: a consolidation and then a breakout. I’d buy when the shares were breaking higher, in my early days, I would have placed a stop loss below a previous low. You can see the first red line at the bottom of the chart.
The share price then starts to run, forms a temporary peak, pulls back, consolidates, and then if it runs higher again, that’s when you can ratchet up your stop. You put it below the most recent low. And if that series continues, and you get a series of higher highs and higher lows, your exit level will go higher each time. As you can see by the progression of the red line, it keeps going higher till at some point the market peaks and falls below the most recent low. This is when you sell your shares and exit trade.
This type of discretionary method is a simple way for someone to manage a trailing stop strategy. You just need a bit of understanding of how a chart looks. If you can identify the higher high, higher low sequence, then you’re on your way. No calculations needed. It’s all done hand to eye.
Host: A lot of those technical traders get those key support, and resistance levels, and work back from there. Alright I know the next one is a percentage based trailing stop. We’ve got an example here. This is the share price for Codan (ASX CDA), walk us through this one.

Jason: The percentage based method is bit different and involves some calculations. Although it’s pretty straightforward. The red line beneath the share price is the trailing stop. For this example, I’ve set the trailing stop at 20%. The way this works is that every time a stock makes a new high, you set the trailing stop 20% below that peak. It will stay there until a new high is made. And then it moves up so that it remains 20% below the peak.
The percentage based trailing stop uses a fixed level that remains constant throughout the trade (in this case 20%). As you can see in this example, Codan’s share price has lots of consolidations and corrections — nothing moves high in a straight line. But the price has stayed within the bounds of a 20% trailing stop (until the end of the trade). And this has allowed someone using this method to stay in what was a really good up trend for over a year.
At some point a stock will peak and come back to the trailing stop. And that’s when it’s time to close the trade. The percentage method is quick and easy to work out. You just need a calculator and maybe a spreadsheet to keep track of multiple trailing stops. But it’s a good way to manage risk.
Host: And the last one is an ATR trailing stop?
Jason: That’s right, the ATR trailing stop. This is the type of exit strategy I use now. It’s more complex than the percentage method and has a few more moving parts. It also requires more than a calculator to work it out. Essentially, it involves calculating the average trading range of a stock over a period of time. I use 30 days. I then multiply that average by 10. Now, 10 isn’t a magic number, it could be 8, 9, 11, 12. But I use 10. I believe this is a good fit for a medium-term trend following approach.
Here’s an example:
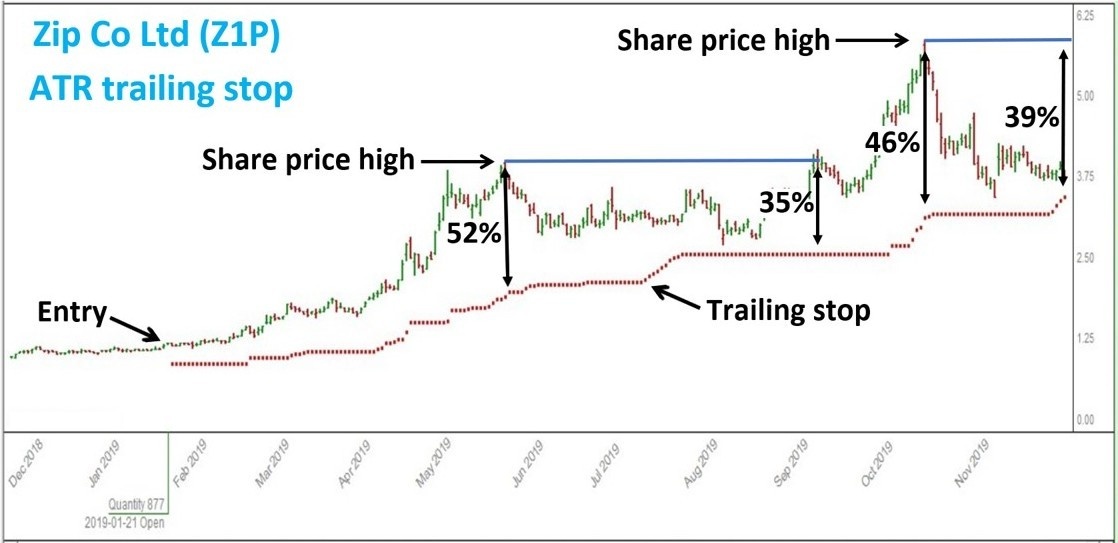
Now if you look at the share price, the first point on the chart is the entry level. Then if you move across to the right, you’ll see a point marked “share price high”. And below that, you can see the width of the trailing stop is 52%.
Some people would say, hey, that’s a pretty wide trailing stop. But remember, this is for a relatively volatile stock. If you want to trade a medium-term trend, then it’s important to give the shares room to move. And that’s the beauty of the ATR railing stop, its dynamic and adjusts to what’s going on with the share price.
If we move along to the right, you can see the trading ranges narrow as the shares go into a congestion zone. The more volatile days dropout of the calculation, and the width of the trailing stock decreases to 35%. Volatility then increases as the shares break higher, and the trailing stop widens again. The cycle continues until at some point the share price hits the trailing stop.
The ATR method is a great way to potentially stay in a stock for longer. And remember, it’s dynamic, so it’s not always going to be as wide as the stop in the example. If you’re trading a property trust, the shares will probably be much less volatile, which will result in a closer trailing stop.
So to compare a percentage based trailing stop to an ATR stop is a bit like comparing an off the rack suit, to a tailored suit. The off the rack suit is probably going to do just fine, but a tailored suit is going to be a little better fitting.
Host: So are you saying, that you’d rather use the ATR over something like a percentage?
Jason: I’d rather use an ATR because it’s going tailor the trailing stop to a particular stock. The percentage method is great if you don’t have the ability to calculate an ATR stop. But I believe the ATR is better overall.
I’ve got another chart I want to show. It compares the ATR to a percentage based stop.
Have a look at this:
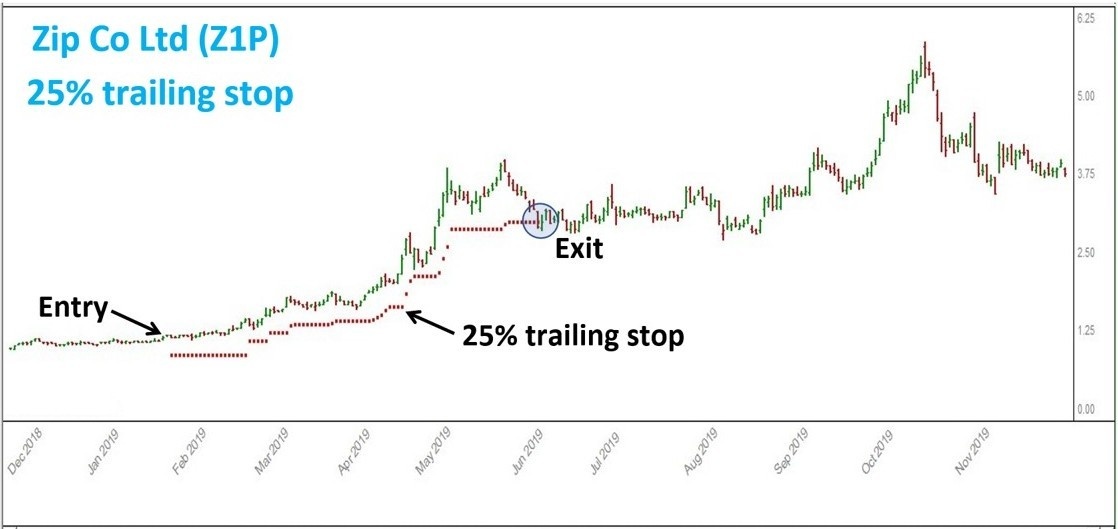
This is the same stock as before. But this time I’ve set a 25% trailing stop. Look how much closer it hugs the share price. It gives the stock a bit of room to move, but because it’s not adapting to the volatility in this stock, the trade hits the trailing stop a lot sooner. And this can take you out of some really good trends that could rise by over 100%. While the fixed percentage is good, I believe an ATR based trailing stop is better.
Host: We’ve got one last chart, Afterpay. You’re looking at an ATR stop on this one as well. Just walk us through this.
Jason: I thought it would be interesting to apply a trailing stop strategy to Afterpay, which was a boom stock after the COVID crash.
Have a look at this:

I’ve applied the same sort of ATR stop that I use. As before, the trailing stop is the red line below the share price. And so you know, the entry point is based off a simple, but effective, strategy. It uses a 50 and 100-day moving average crossover, in conjunction with a 70-day break out high. I haven’t marketed these on the chart as the focus is the trailing stop.
It’s interesting to consider how many people would have bought Afterpay in May 2020. Many people would have got in. But now how many of those people rode the multi-hundred percent rally?
Look at the chart… there were several corrections in the teens, and one comes back by 26%. That can make it hard for a discretionary trader stay in. Unless you’re buying and holding, then many people get bucked off the trend. It can be emotionally difficult to sit through those corrections.
But if you use an ATR stop, or a trailing stop of any description, then it helps remove much of the emotion. You’re not second guessing what the market. You have a calculated exit point, and you know where you’re getting out. While you don’t know what the market will do next, you know what you’re going to do.
A trailing stop doesn’t work with precision every time… nothing does. But it’s about applying a robust strategy consistently over time, and that lets the law of large numbers do its thing. The more you follow a robust process, the more you’ll maximise your chances of getting on big trends. The aim is to ride those trends for triple digit gains, rather than making 20% and looking back wishing you’d held.
Host: I guess the takeaway is that not all trailing stops are made equal. So you’ve gotta pick your right one.
Jason: A lot of people like to protect open equity. So they set a 10% trailing stop. They get the theory, but in practice, it doesn’t work because stocks that rise 100% usually have more than 10% consolidation. So you’ve got to give a stock room to move. That’s the secret to making the whole thing work. And if you get that, then you’re in with the show.
And remember, understanding when to sell is only half the equation — knowing when to buy is just as important. If viewers want to learn how to spot shares in strong, sustained trends, see my guide on how to find ASX stocks in a strong uptrend.
Another valuable strategy to understand is to use breakouts as entry points. I have a guide that can help with that too: ASX breakout strategy
Host: Yes, it’s all about identifying trends and knowing your selling point. Jason, thanks so much for joining me on The Trade this afternoon we would love to have you back soon.
Jason: It was fun, Kara, I would love to be back.
Looking for a free stock market training course?
Learn how to identify some of the best stocks to buy now in this free video training. You’ll learn a complete stock trading strategy for buying and selling shares with confidence. We’ll also share real life examples to help you apply the knowledge and build a profitable share portfolio.
Where to invest now?
Looking for ASX stocks to buy now, as well as off the radar ideas most people don’t know? Our algorithms scan the stock market daily for medium term investment trends. We then tell our members precisely when to buy shares. And most importantly, we tell them when to sell.
If you’re ready to get started, try a free 14-day trial of Motion Trader, and see what an algorithmic trading approach could do for you.

Jason McIntosh | Founder, Motion Trader
Jason’s professional trading career began over 3 decades ago. He’s a founder of two stock advisory firms, a listed funds management business, and has helped thousands of investors navigate the stock market. Click here to read Jason’s incredible story of, at age 20, sitting alongside some of the world’s greatest traders (and the life changing experience that came with that).
Meet Jason

I'm Jason McIntosh, the creator of Motion Trader. My career began in 1991 on the trading floor at Bankers Trust. Nowadays, I trade my own systems from home in Sydney.
Motion Trader is for investors who value robust analysis, data driven entry and exit signals, commentary, and education. I use engineered algorithms to identify when to buy and sell ASX stocks. No biases or guesswork, just data driven signals.