Discover Undervalued ASX Stocks: A Step-By-Step Guide to 3 Powerful Methods

By Jason McIntosh | Updated 4 November 2025
Are you interested in finding undervalued stocks in the Australian stock market? These hidden gems are often overlooked by investors, but have the potential to grow rapidly.
Then look no further….
With the help of trend following and technical analysis, you could uncover undervalued ASX stocks before most investor catch on. This guide will walk you through the process of identifying and evaluating undervalued stocks using these powerful tools, so you can start building a portfolio of high-potential investments.
What are Undervalued Stocks?
Undervalued stocks are stocks that are trading at a price lower than their intrinsic value. In other words, the market is not accurately reflecting the company’s true worth. This can be due to a variety of reasons, including temporary setbacks, investor sentiment, or (in many cases) a lack of awareness about the company and its potential.
Using Technical Analysis and Trend Following to Identify Undervalued Stocks
Technical analysis is the study of past market data. It analyses price and volume to identify trends and understand possible future price movements. By analysing charts and using technical indicators, investors can gain insights into a stock’s behaviour and identify potential opportunities.
A widely-used subset of technical analysis is trend following. It operates on the belief that trends persist over time, and by following them, investors can identify opportunities to buy undervalued stocks before they reach their true value.
The key to using trend following techniques is to understand how market trends develop and evolve over time. One approach is to look for stocks that are turning higher after a period of poor performance. This can be a sign that the trend is changing from down to up, and this is often a point of undervaluation.
To identify these trends, investors often use technical analysis tools such as moving averages, trend lines, and momentum indicators. These tools can help identify key levels of support and resistance in the market, as well as potential entry and exit points.
Here’s an example of a moving average:
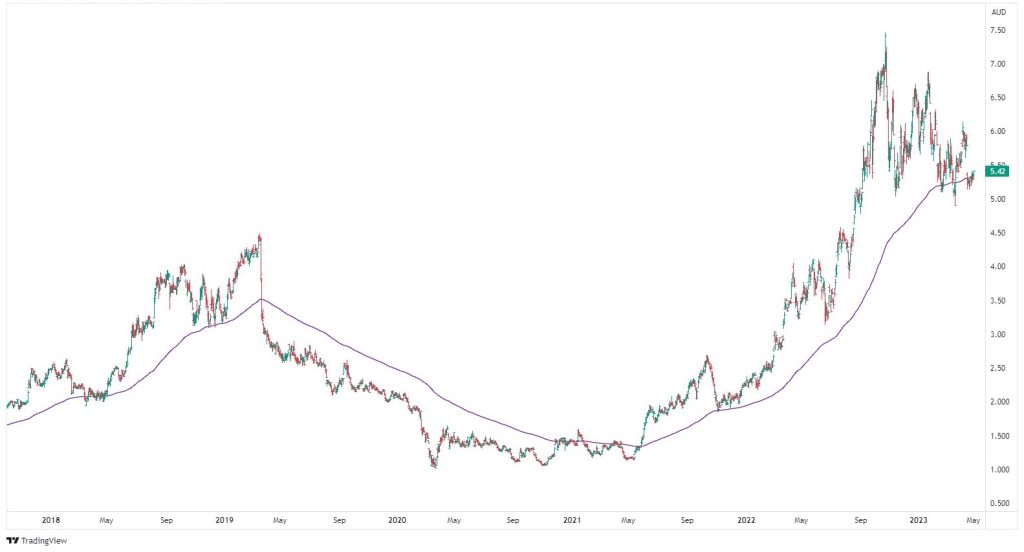
This is a share price chart for New Hope Coal [ASX:NHC]. You’ll see a smooth line that moves both above and below the share price. That’s the 200-day moving average — a simple, yet effect method of screening for investment opportunities.
There are many was to use moving averages. But a popular trend following technique is to only consider buying when the share price is above the moving average.
From an undervaluation perspective, a time to consider investing is when a stock crosses back above the moving average after a period of falling prices. This is often a safer way of buying a potentially undervalued stock (as opposed to buying as prices are still falling).
Moving averages can also help investors avoid stocks that are still in downtrends. While a stock may appear cheap, if the trend is down, there’s a high probability that it will getter cheaper still. Look at how New Hope performs while it’s share price is below the moving average. It’s generally a good time to be out of the stock.
Trend following techniques can help investors identify which undervalued stocks to buy, and which ones to avoid. Many people only consider the former. But the second point (avoiding stocks in down trends), is critical for protecting capital and long term success.
Using Fundamental Analysis to Evaluate Undervalued Stocks
Fundamental analysis involves analysing a company’s financial statements and other qualitative and quantitative factors to determine its intrinsic value. By evaluating a company’s financial health, competitive position, and growth prospects, investors can determine whether a stock is undervalued or overvalued.
While many successful investors rely primarily on technical analysis, others apply fundamental studies to zero on the opportunities that suit them best. This can also narrow the number of opportunities to an even more concentrated list of high potential candidates.
Some of the best investment opportunities are when a stock stacks up both technically and fundamentally. A double green light can increase confidence in an investment and act as a valuable cross-check for when to buy.
Using Algorithms to Identify High Potential Stocks
Algorithms can be used to quickly scan the entire market and identify undervalued stocks that meet certain criteria. By using technical indicators and other filters, algorithms can quickly identify stocks that may be undervalued and have the potential for future growth.
A key advantage of algorithms is they allow investors to analyse many more stocks. This can help them identify opportunities that they may have otherwise missed.
For example, an algorithmic screen may identify undervalued stocks that are starting to trend above their moving averages and have broken to a new high. This can help investors quickly identify a short list of high-potential stocks that they can then use fundamental screens to evaluate in more detail.
Many professional traders and investors incorporate a breakout trading strategy in their scans. The rules can also be also be applied manually to a chart and can be a highly effective means of providing extra confirmation of a trend.
Examples of Undervalued Stocks on the ASX
Let’s take a look at some real-life examples of how trend following techniques can help identify undervalued stocks earlier, before they become widely known in the market.
Calix Ltd (CXL)
Calix Ltd is a technology company that develops environmentally friendly solutions for various industries, such as agriculture, wastewater treatment, and energy storage. Despite its innovative solutions, Calix flew under the radar for many investors due to its relatively low profile.
Have a look at the chart:
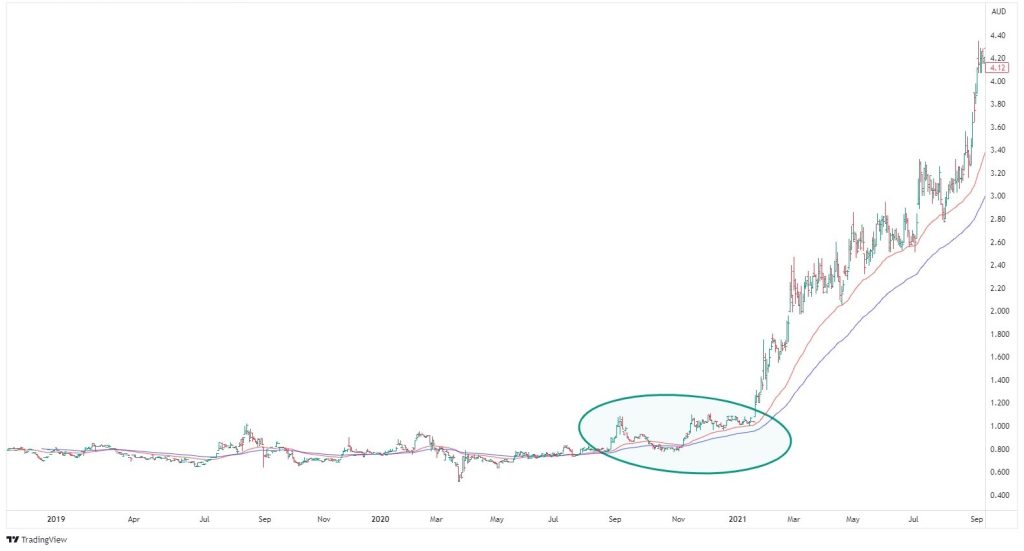
This chart shows a dual-moving average screening technique. When the 50-day average (red line) crosses the 100-day average (blue line), a stock is considered as a potential buy.
You’ll see the green shaded area. This highlights a period when the Calix satisfied the moving average entry criteria.
There were earlier periods that didn’t lead to sustained price gains, and that’s normal. The point is to use the moving averages to screen for opportunities. Decisions can then be made to the merits of an investment.
Moving averages are one of the most effective ways of identifying an ASX stock in a strong uptrend. This also helps separate high potential stocks from those still in downtrends, which can significantly reduce the number of possibilities that an investor needs to select from.
Calix wasn’t in the top 500 stocks when it was most undervalued. This can make a highly profitable opportunity even harder to find. But by using algorithms and trend following techniques, Calix was easily identifiable.
Investors who bought at the right time were able to benefit from its low profile and undervaluation. Calix’s share price rose by over 700% in the 12 months from November 2020.
Kelly Partners Group (KPG)
Kelly Partners is a financial services company that provides accounting, taxation, and business advisory services to individuals and small to medium-sized enterprises (SMEs). Similar to Calix, Kelly Partners was relatively unknown by investors, despite its solid financial performance.
Could you have found this stock when it was most undervalued?
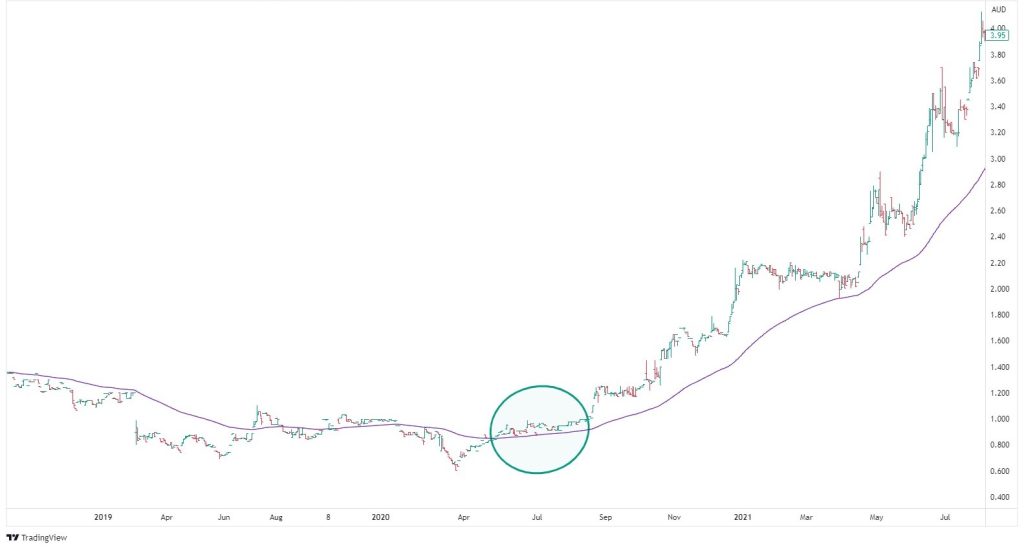
Using trend following techniques, investors who identified Kelly Partners’ uptrend earlier could have benefited from its undervaluation. From October 2020 to February 2022, Kelly Partners’ stock price rose from around $0.80 to over $5.00 (a gain of more than 500%).
Incidentally, both Calix and Kelly Partners appeared in Motion Trader’s algorithmic scans. The scans target stocks with the potential to trend significantly higher. It also applies risk management strategies to help protect capital when prices fall (you can read more about that here).
Summing it all up
Identifying undervalued stocks on the ASX can be a difficult task, even for professionals. With more than 2,000 listing, many people simply focus on a narrow group of large well-known names. However, by pairing algorithms and trend following techniques, investors can potentially identify a wider range of undervalued stocks earlier.
Companies like Calix and Kelly Partners may have flown under the radar of many investors due to their low profile. But trend following techniques could have made their undervaluation easier to identify. By identifying emerging uptrends in ASX stocks, investors can potentially gain an edge in the market and capitalise on opportunities for future growth.
If you’d like to know more about algorithmic trend following, and if you want to learn about the type of entry and exits rules many professionals use, then I have a series of videos and articles that could help.
I’ll also show you how a trend following algorithm applies rules in real-time.
You can get all the details here

Jason McIntosh | Founder, Motion Trader
Jason’s professional trading career began over 3 decades ago. He’s a founder of two stock advisor firms, a listed funds management business, and has helped thousands of investors navigate the stock market. Click here to read Jason’s incredible story of, at age 20, sitting alongside some of the world’s greatest traders (and the life changing experience that came with that).
Meet Jason

I'm Jason McIntosh, the creator of Motion Trader. My career began in 1991 on the trading floor at Bankers Trust. Nowadays, I trade my own systems from home in Sydney.
Motion Trader is for investors who value robust analysis, data driven entry and exit signals, commentary, and education. I use engineered algorithms to identify when to buy and sell ASX stocks. No biases or guesswork, just data driven signals.