How to Analyse a Stock Before Investing: 4 Powerful Steps to Smarter Decisions

By Jason McIntosh | Published 6 June 2023
The prospect of figuring out how to analyse a stock before investing can be daunting. It’s little wonder many people simply opt for an index fund. But for investors willing to do some extra work, individual stocks offer the potential for big rewards.
This article will take you through a four step assessment process. It will help you learn how to identify high potential opportunities in the stock market. I’ll then discuss some of the tools for making smarter investment decisions.
But before you can even consider buying a stock, you need narrow down your choices.
Step 1
Stock Screening Strategies: How to Find the Best Stocks
The market provides a seemingly endless number of potential opportunities. An investor’s first challenge is to sort through the contenders. But how do you narrow down the list and identify stocks worth considering?
This is where stock screening strategies come into play. By setting specific criteria and utilising stock screeners, you can filter out the noise and focus on the stocks that align with your investment goals.
One effective screening tool is to identify potential stocks by using moving averages. Moving averages help investors gauge the overall trend of a stock’s price movement over a specific period. By calculating the average price of a stock over a set number of days, moving averages smooth out a stock’s fluctuations and provides a clearer picture of the overall share price trend.
Moving averages can be particularly useful for identifying emerging upward trends. They can also help traders and investors avoid stocks that are in downtrends, which may carry greater risk.
Here’s an example:
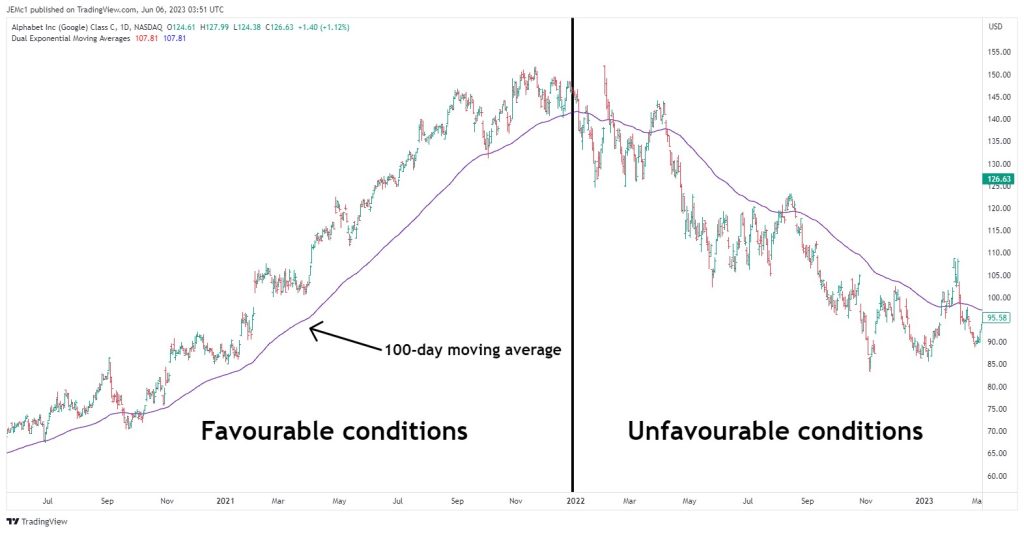
This is a share price chart for Alphabet (A.K.A. Google), that’s trades on the Nasdaq.
A simple and effective approach is to compare the stock’s current price to its moving average. If the stock’s price is consistently trading above its moving average, it suggests an uptrend. Stocks that demonstrate positive price momentum could then be put aside for further investigation.
Conversely, if the stock’s price consistently trades below its moving average, it indicates a potential downtrend. Stocks in downtrends typically pose higher risk, as they may continue to face selling pressure and struggle to regain positive momentum.
Investors can set specific criteria when using moving averages as a screening tool. For example, they may look for stocks that are trading above a 50 or 100-day moving average. This approach helps filter out stocks that have not shown sustained upward movement, and focuses attention on those that have demonstrated relative strength and positive price trends.
It’s important to note that moving averages don’t guarantee success. Market conditions, company-specific news, and other factors can impact a stock’s performance. A professional investor/trader might use a moving average as one part of an overall trading/investment process. They’ll typical also have a robust risk management strategy.
Step 2
Fundamental Analysis: Evaluating the Company’s Financial Health
After applying screening strategies to narrow down the list of potential stocks, many investors use fundamental analysis to evaluate a company’s financial health. This process involves researching and assessing various aspects of a company to gain a deep understanding of its operations, competitive position, and growth prospects.
Once the initial screening is done, investors often consider their personal preferences and investment goals to further refine their choices. For instance, some investors may prefer investing in large-cap companies with established track records and stable market positions. These companies are often seen as relatively safe investments due to their size, resources, and market dominance.
On the other hand, some investors may seek opportunities in smaller or mid-cap companies that have the potential for rapid growth. These companies may operate in emerging industries or possess innovative products or services, which can provide significant growth opportunities for investors willing to take on greater levels of risk.
Sector preference also plays a role in fundamental analysis. Certain investors may have an interest in specific sectors, such as technology, healthcare, or renewable energy. They may believe in the long-term growth potential of these sectors and focus their analysis on companies operating within them.
Investors may also consider whether they prefer growth stocks or value stocks. Growth stocks are companies with the potential for above-average expansion in revenue and earnings. These stocks typically trade at higher valuations, as investors are willing to pay a premium for the potential future growth.
In contrast, value stocks are companies that may be undervalued relative to their intrinsic worth. Investors seeking value stocks look for companies with solid fundamentals but whose stock prices may not fully reflect their true value, providing opportunities for potential appreciation.
Dividends can also be an important consideration for investors. Dividend-paying stocks distribute a portion of their profits to shareholders on a regular basis, providing a steady income stream. Some investors may prioritise dividend-paying stocks, particularly those seeking income or looking for a combination of income and potential capital appreciation.
Fundamental analysis can help investors can make better decisions. The key is to determine what type of fundamental investor you are. This will help identify the type of companies that suit your investment profile.
But fundamental analysis isn’t the only way to access a stock’s prospects. Another popular and effective method is called technical analysis.
Let’s look at that now.
Step 3
Technical Analysis: Identifying Stock Price Trends and Patterns
I touched on a form of technical analysis earlier when discussing moving averages. This type of stock analysis can help investors understand stock price trends and narrow the field of possibilities.
But technical analysis is a much wider topic with many more uses. For example, technical analysis can play a crucial role in identifying entry and exit points. In additional to determining the optimal time to buy or sell a stock, many traders/investors use technical analysis to help manage risk, and assess the potential upside of an investment opportunity.
One popular technical entry strategy is to use price breakouts. A price breakout occurs when a stock’s price surpasses a key level of resistance, indicating a potential upward shift in a stock’s trend. Investors often look for breakouts as a potential entry trigger, as they suggest a stock has the momentum to continue rising.
Additionally, technical analysis aids in establishing exit points through the use of trailing stops. A trailing stop is a dynamic stop-loss order that adjusts as a stock’s price moves higher. By setting a trailing stop, investors can protect a large portion of their profits, while allowing a stock to continue climbing. If the stock price reverses and reaches the trailing stop, the investor exits the position.
When considering entry and exit points, it’s crucial to assess risk. Technical analysis helps in evaluating the risk/reward profile of an investment opportunity. Investors must ensure that the potential reward justifies the risk. Many successful investors adhere to a principle where the potential reward should be at least three times greater than the risk. This helps ensure that even if some trades lose money, the overall portfolio should be profitable.
Technical analysis provides valuable tools for assessing risk. By examining indicators such as volatility, trend strength, and momentum, investors can gauge the probability of a trade’s success. For instance, indicators like the Average True Range (ATR) can help determine the stock’s volatility, allowing investors to adjust their position size accordingly.
Furthermore, technical analysis helps investors identify key support and resistance levels, which act as price barriers. These levels can be used to set stop-loss orders, limiting potential losses if the stock’s price trend reverses direction.
By combining technical analysis with proper risk management techniques, investors can make informed decisions about position size and risk tolerance. This approach ensures that the potential reward of an investment justifies the risk taken — one of the key principles of successful investing.
Many people believe they have to choose between either fundamental or technical analysis. But this isn’t true. Combining the two could be the best thing you could do.
Let me tell you what I mean.
Step 4
Combining Technical and Fundamental Analysis: A Holistic Approach
The final step is to bring it altogether.
Technical analysis and fundamental analysis are powerful in their own right. They can help you gain valuable insights to a company, and they can help you buy the right stocks for your portfolio.
But what if they were to join forces?
Some of the best traders and investors do exactly that: they combine both forms of analysis.
And when done well, this can create a powerful analytical approach.
One well-known example is Paul Tudor Jones. Jones is a hedge fund manager and billionaire investor. He has his own take on how to analyse a stock before investing. Jones places importance on understanding the fundamental factors that drive markets. At the same time, he uses technical analysis to identify entry and exit points, and manage risk.
Jones has attributed much of his success to the integration of technical and fundamental analysis. He believes that combining these two approaches provides a more comprehensive view of the markets and enhances his ability to make profitable investment decisions.
The merging of technical and fundamental analysis is a common practice among experienced and successful traders and investors. By applying both approaches to their investment analysis, they can gain a more well-rounded understanding of a stock’s potential.
While technical analysis provides insights to price trends, fundamental analysis offers a perspective on a company’s intrinsic value and long-term potential. When these two methods align, it can indicate a high-probability investment opportunity.
For example, suppose a stock has a bullish chart pattern, signalling a potential upward trend according to technical analysis. At the same time, fundamental analysis reveals positive earnings growth, strong revenue streams, and a favourable competitive position. Such opportunities, where technical and fundamental analysis confirm each other, are often considered some of the best opportunities in the stock market.
Combining technical and fundamental analysis can also help manage risk. While technical analysis can identify entry and exit points, fundamental analysis provides insights into the company’s overall financial health and growth prospects. By considering both aspects, investors can make more informed decisions about position size, risk tolerance, and potential reward.

Jason McIntosh | Founder, Motion Trader
Jason’s professional trading career began over 3 decades ago. He’s a founder of two stock advisory firms, a listed funds management business, and has helped thousands of investors navigate the stock market. Click here to read Jason’s incredible story of, at age 20, sitting alongside some of the world’s greatest traders (and the life changing experience that came with that).
Meet Jason

I'm Jason McIntosh, the creator of Motion Trader. My career began in 1991 on the trading floor at Bankers Trust. Nowadays, I trade my own systems from home in Sydney.
Motion Trader is for investors who value robust analysis, data driven entry and exit signals, commentary, and education. I use engineered algorithms to identify when to buy and sell ASX stocks. No biases or guesswork, just data driven signals.