Expert Trading Techniques to Make Money from the Share Market

By Jason McIntosh | Updated 27 April 2023
Making money from the share market is hard. There’s no way around that.
But with the right trading techniques, it’s possible to put the odds in your favour.
This trading strategy guide will explain two of the most powerful indicators. These provide the framework for many professional trading strategies.
The stock trading techniques you’re going to learn have two objectives:
1. They help identify some of the most promising stocks
2. They also eliminate many of the most dangerous
The first trading technique is: a dual moving average crossover cross over system. It’s a favourite for both long and short term trading.
Let me explain what that means…
Trading Technique #1: Crossover system
A moving average (MA) is a calculation of a stock’s closing price over a set number of days. Short term traders often use MAs that calculate a few days of data (for example, 5 days), while longer term trading typically involves slower MAs (for example 50 days).
Let’s use 50 days as an example…
The 50-day MA shows a stock’s average closing price over the last 50 days. Each day, the oldest close (the close from 51 days ago) drops off, and most recent close will take its place.
The 50-day MA is simply this: A rolling average of the closing price over the past 50 days.
Here’s what a 50-day MA looks like:
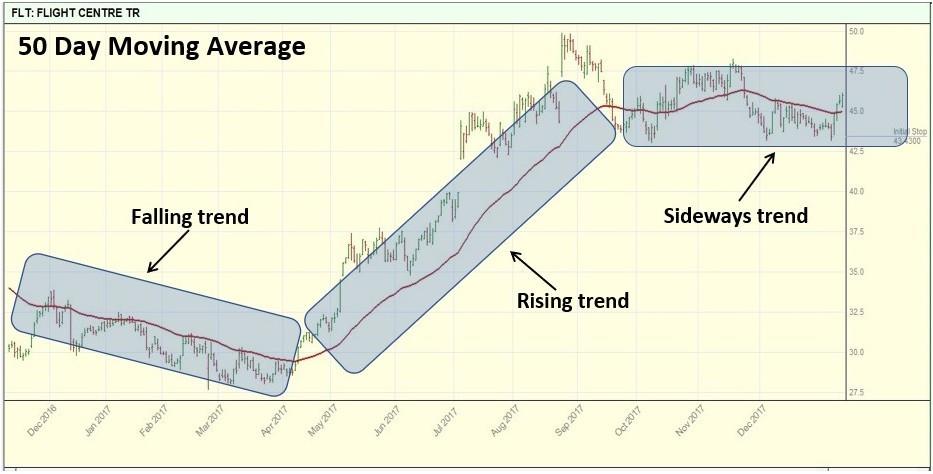
50-day moving average
Notice how the MA smooths the ups and downs in the share price. It filters out the “noise” of daily stock price movements. This helps give a clearer picture of what’s happening.
The slope of the MA indicates the direction of the trend.
As you can see, the average can be rising, falling or sideways.
MAs are a lagging indicator. Which means they are calculated with historical data. This indicator doesn’t predict what will happen. Its job is to help identify what’s happening now.
A popular trading technique is to combine two moving averages (for example, a 50-day MA with a longer term 100-day MA. A stock’s overall trend is upwards when the 50-day average is higher than the longer average.
The opposite is true when the 50-day average crosses below the 100-day average.
Here’s an example of an uptrend:
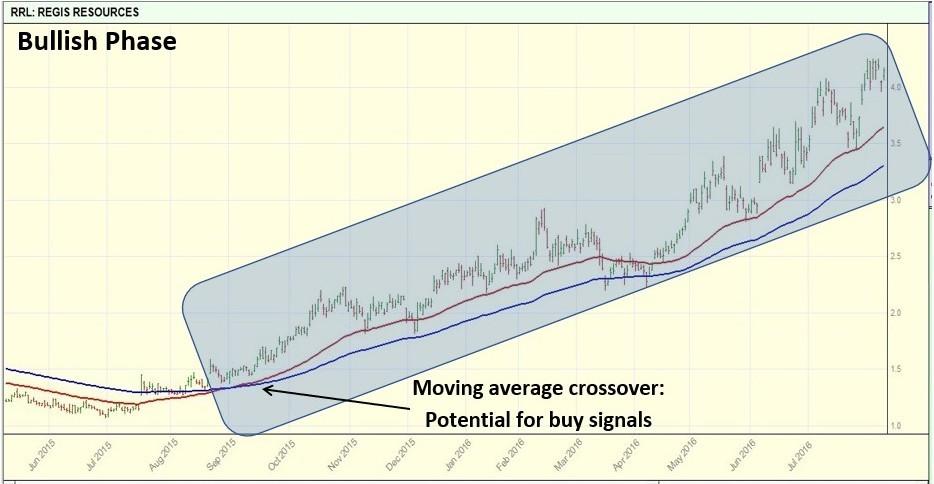
Bull market phase
Look at the two MAs on this chart. The red line is 50-day average. Notice how it crosses above the 100-day average. This indicates the stock is in a rising trend.
A moving average crossover indicator is an excellent trading strategy to identify, and trade uptrends. It won’t try to predict the future. Instead, it focuses your attention on the present.
The trading technique is simple: Trade in the direction of the trend.
The process works the opposite way when the averages are falling.
Here’s an example:
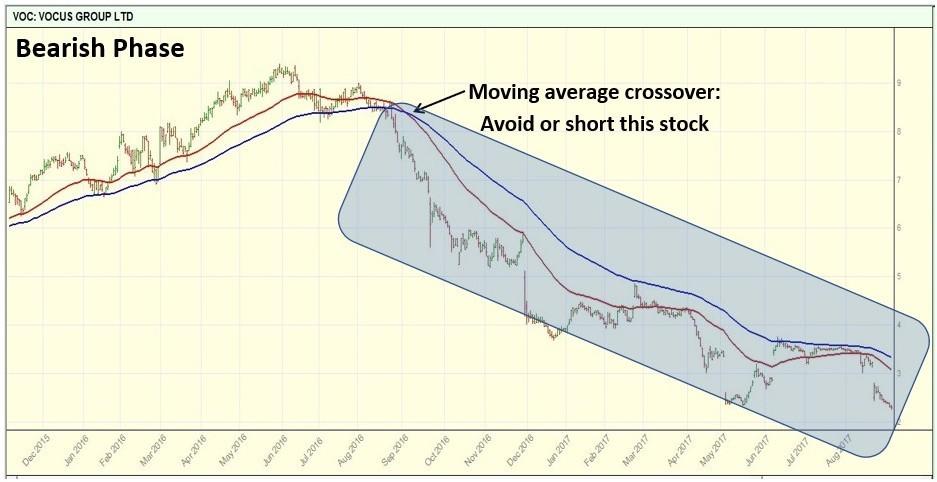
Bear market phase
Notice when the red 50-day MA crosses below the 100-day MA. This signals a bearish phase is underway. Many professional traders will avoid buying a stock during this period.
And this often gives the pros an advantage — they can avoid trading against the trend.
Many retail traders do the opposite. Rather than steering clear of falling stocks, they’ll step in to buy. But as bargain hunters discover, a cheap stock will often get even cheaper.
The MA crossover indicator won’t get you in at the low. That’s not what it does. Its aim is to capture the big middle part of the trend. This is often where the best gains are.
Another way to think of MAs is like a rudder on a ship. Many of the pros will only trade in the direction of the averages — just as a ship will only head in the direction of its rudder.
You can read how technical analysis can help find undervalued stocks here.
This short video shows how you could use moving averages.
Trading technique #2: The Breakout strategy
Moving averages are a great way to make money from the share market. But they can be even more effective when you pair them with the right tactical strategies.
A popular professional trading technique is a: Breakout strategy. If you’re learning technical analysis, this method ensures you only buy a stock that’s hitting new highs.
Now, I’m sure you know the saying: Buy low, sell high.
The problem with this is that many people interpret it incorrectly. They think buy low means to get in when prices are falling, and sell high is about getting out when prices are on the rise.
Buying falling prices and selling rising prices is all wrong.
In fact, it’s a sure fire way for many people to go broke.
Many of the pros do the opposite: They buy into strength and sells into weakness. Their strategy is to trades WITH the market, not against it.
Think of it like this: Is it easier to swim with or against the tide?
Trading is no different.
As they say, the trend is your friend until the end when it bends.
The Breakout strategy is an important trading technique that can help improve performance. It reduces the number of buy signals and filters many unprofitable trades.
It will also help you avoid a big trading error (see common trading mistake #2).
Here’s an example:
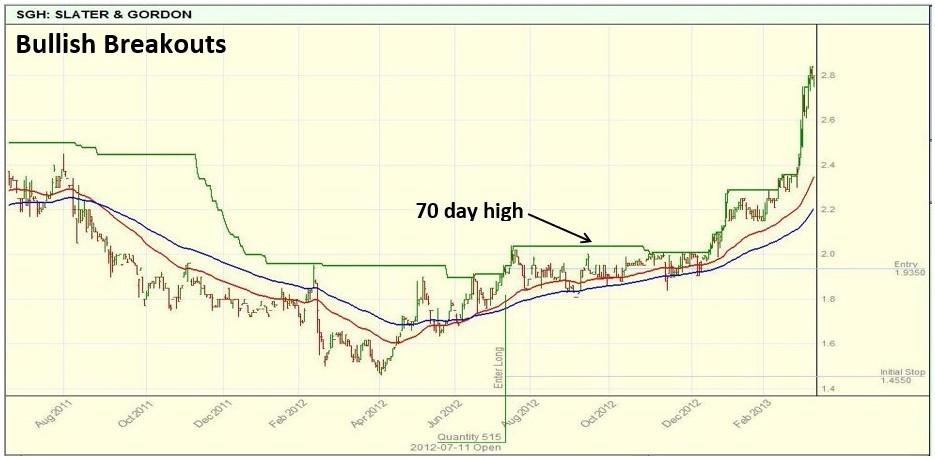
Bull market breakout
This is a share price chart for the law firm Slater & Gordon (SGH).
The green line above the share price is the 70-day high. I’m using 70 days for this example, but it can be any number you like. The strategy is to stay out until shares hit this line.
A Breakout strategy typically results in a higher buying price. But it’s an important safeguard — a defensive strategy that helps keep you out until prices are moving higher.
Breakouts can be even more effective when combined with stocks already in strong uptrends. If you’d like to know how to identify those opportunities, see our guide on how to find ASX stocks in a strong uptrend.
Start to trade the right way
We hope this trading strategies guide was helpful.
If you’d like to learn to trade and invest in stocks, register for our free video training on share trading for beginners. It explains the process many investors use to build profitable share portfolios. The step-by-step instructions aim to help you start trading stocks right away.
Meet Jason

I'm Jason McIntosh, the creator of Motion Trader. My career began in 1991 on the trading floor at Bankers Trust. Nowadays, I trade my own systems from home in Sydney.
Motion Trader is for investors who value robust analysis, data driven entry and exit signals, commentary, and education. I use engineered algorithms to identify when to buy and sell ASX stocks. No biases or guesswork, just data driven signals.