Will interest rates go up? And can bond yields keep rising?

By Jason McIntosh | Published 20 April 2022
There’s been heaps said in recent times about higher interest rates and rising bond yields. And I’m not going to add to the volumes, which has already been said. What I am going to do is to make you aware of something that I haven’t seen anyone else talking about. And I’m going to do this with a chart, it’s a chart you’ve probably never seen before. This is one of the great thing about charts, they can take you to either a time that you can’t remember or never experienced.
Have a look at this chart:
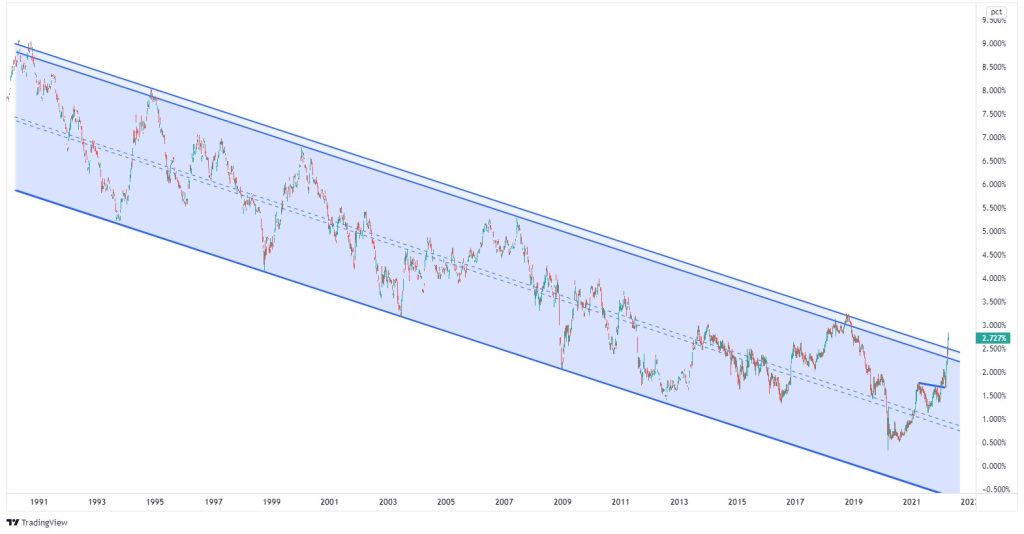
This is a chart of the U.S. 10-year government bond yield. And it’s a really long-term one. It goes all the way back to 1980. This chart spans my entire financial markets career, plus almost another dozen years.
It’s basically seen everything. It’s seen wars, globalisation, booms, crashes, new technology, recessions, you name it. This is probably the most important chart in finance. And since 1985, it’s been in a long-term, downward trend channel.
Now, the really interesting thing, which I’m bringing to your attention is that the bond yield has recently broken upwards out of the channel. It’s the first time this has happened since the early 1990s.
Let’s zoom in a bit and put on some moving averages.
Have a look at this:
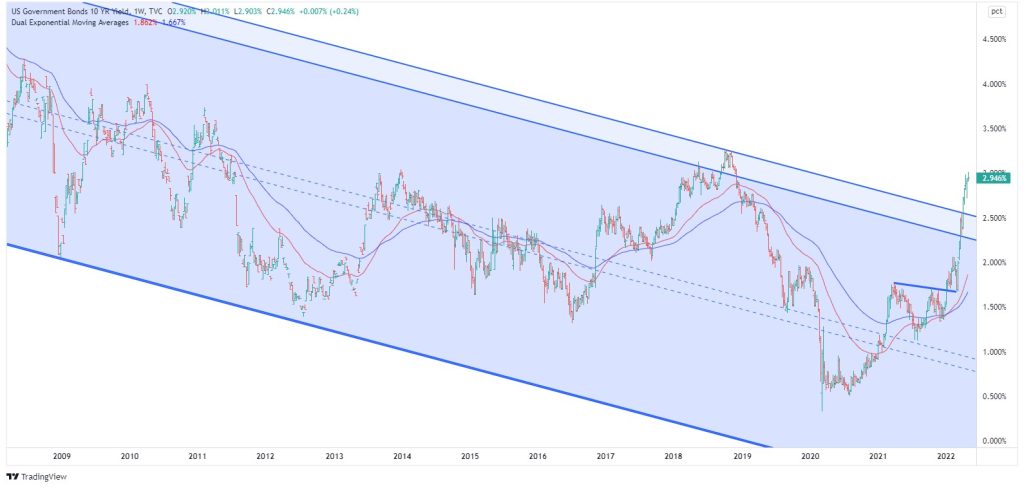
This is a weekly chart, so we’re looking at the 50-week and the 100-week moving averages, and you can see that they’ve turned higher. When the moving averages turn higher, and they’ve crossed, it’s a sign that a market is starting to trend upward. So this is a really interesting situation that we’re seeing.
I’ve been hearing people call for the end of this multi-decade bull market for years and years. Even early in my career during this 1994 sell-off, and then again in 1999 leading into the tech burst, people were calling for an end of what was then really a multi-year bull market.
And then again during the 2000s, a lot of people saying, that bond yields had bottomed and were heading higher. But this has probably been the most persistent trend in finance because every time people have called for a bottom, it hasn’t happened.
But, as I was saying before, for the first time since 1987, we have a significant break of the trend channel.
So, what does the break from this trend channel mean?
The truth of the matter is that I don’t know. And I say that because this is such a long-term pattern. We don’t have that many examples of such a long-term pattern breaking.
But let’s look at the theory around a trend channel, and consider how shorter-term channels work. We often see two scenarios.
The first possibility is that a trend channel break is telling us that the market has lost downward momentum. But rather than turn higher and go into a new bull market, the market then starts to track sideways in a big trading range.
If that sort of scenario were to happen, we could see bond yields move back and forth for several years. That would probably be the best-case scenario for the markets to see yields start to stall and then track sideways.
But if this were a stock chart, showing price action over a year or two, then I’d be looking to buy the momentum. I’d be looking to buy the breakout because when a trend channel breaks, the change in momentum can trigger a large advance. And if we get that sort of price action developing in bonds, then that becomes a new uptrend.
And that could become a problem which has serious implications for the stock market, the property market, and the financial system generally. So it’s something I believe investors need to be aware of… they need to be aware that yields have broken higher, and this could lead to a persistent rise in yields.
I’ve got my doubts that we’re starting to see a big multi-year uptrend in yields develop. And I say that because there’s so much debt built up into the global financial system that I think a persistent upward trend in yields would cause all sorts of problems. My preferred case is that yields move sideways in an extended trading range for several years.
But either way, I’m aware that this is a breakout. And just being aware there’s a breakout means I’m better prepared to manage the possibilities. The same applies to you as well. And that’s what successful trading and investing is all about. It’s about understanding the possibilities so we can maximize our returns, while at the same time managing risk and protecting capital.
It’s much harder to do so if you don’t understand the possibilities. And just one last point to leave you with, for now, just moving this to a daily chart for the moment. This is a very strong move we’ve had in a fairly short space of time. And it does look somewhat overextended in the near term.
One last point, this isn’t an outlook for the next week or month. This is something to be aware of over the next year, two, or three, or even beyond. And the big question, I think, for many people is do rising interest rates hurt stocks? I’ll be back with the answer to than in the next article.
Looking for the best ASX stocks to buy now?
Motion Trader‘s algorithms scan more than 2,000 ASX stocks daily in search of medium term investment trends. We then tell our members precisely when to buy shares. And most importantly, we tell them when to sell.
Try a no obligation FREE 14-day trial of Motion Trader, and see what an algorithmic trading approach could do for you.
Meet Jason

I'm Jason McIntosh, the creator of Motion Trader. My career began in 1991 on the trading floor at Bankers Trust. Nowadays, I trade my own systems from home in Sydney.
Motion Trader is for investors who value robust analysis, data driven entry and exit signals, commentary, and education. I use engineered algorithms to identify when to buy and sell ASX stocks. No biases or guesswork, just data driven signals.