Is Telstra a buy? Plus 2 Stocks with Technical Chart Patterns
Click here to give a thumbs up or leave a comment
Host: Of course, it is reporting season and it is coming to an end. So let’s get a technical read on some of those heavy hitters. Jason McIntosh from Motion Trader, joins us now live. Jason, great to have you on. Look it’s such a busy week. So much noise in the markets at the moment. You’ve got those US markets on record highs once again, the local market, of course, fixated by some of those local company reports. So paint the picture for us when it comes to the charts. I mean, let’s maybe start with that local market. The All Ordinaries.
Jason: Yeah, look lots going on isn’t there? The Fed’s meeting at the moment over in Jackson Hole? So that’s, who knows. That’s probably going to create some sort of movement in the markets as well. So look, I thought it might be good to just kick off with the All Ordinaries and have a look at what the local market’s doing. And look, what we’ve got here is it’s such a really nicely defined upward trend channel the market’s been in for pretty much of the year. And it’s interesting just seeing where we got to 3 weeks ago. We got up to the top of that trend channel and then bounced down off it. We’re back now in the middle of the range and I think a key point to keep an eye on over the next, look, over the next week or so is that support which was coming up just below the market now. So that support comes from some previous highs from a few months ago and we’ve also got that 50 day moving average coming in and intersecting around that same point. I think it’s a bit of a key pivot point for the market.
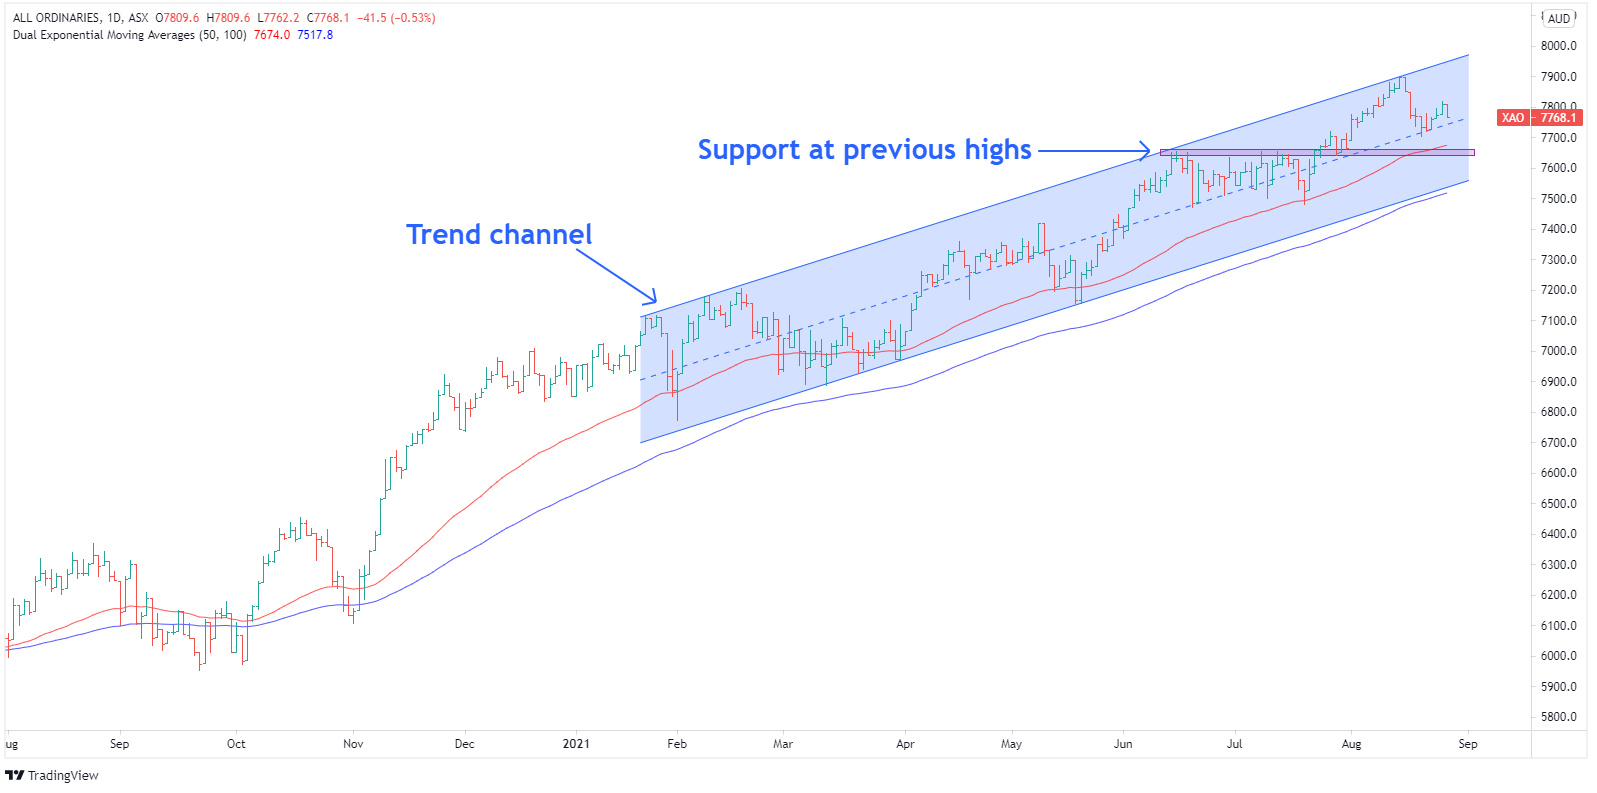
If the bulls are going to remain in control, which they very much have been for some time now, I think these levels need to hold. If we break, well then it opens up the possibility of some consolidation which could go on for more than a few days. So let’s just watch this level. I think let’s favour that if we can go sideways for a few days, maybe another week or so, maybe we get another lift up towards the new high, but we know the levels to watch.
Host: Yeah, we’re talking of bulls in control. Let’s have a look at that US market, that Dow and the chart. What are we talking in terms of levels? I mean, how do you compare what we’re seeing in the US to what we’re seeing here?
Jason: Yes, the Dow, well, the US market is really a tale of different indices like the NASDAQ’s really strong. The S&P has been very strong as well, Dow’s been dragging the chain. And then you drop down to the Russell 2000, and it’s really, really lagging. So looking at the Dow, it broke above those highs probably about a month ago now, had a run, came back, retested those previous highs, which are now support. Really, I think the levels are quite clear cut. We need to hold above those previous highs on that support zone there to keep the bullish play in action at the moment. Break below there opens up the window for a larger consolidation. But look, if the bulls can maintain the line at that support where the moving average is as well, well then you open up the window to another leg up.

But again, it’s going to be interesting to watch over the next couple of days with this Jackson Hole stuff going on to see how the market responds to the news flow that we see coming out of it.
Host: Yeah, definitely a big event risk there, the Jackson Hole symposium. Jason, let’s get back to reporting season. I’m sure you’ve got a close eye on some of the local plays. I know Telstra (ASX:TLS) is one of them. Let’s have a look at the chart. I know it’s kind of validating what you’re seeing in some of that news cycle.
Jason: Look it’s so interesting. What I often find happens is that the news flow tends to validate the pre-existing trend. It doesn’t happen all the time. You get left field results and left field news and markets can rapidly change direction. But more often than not, the news flow validates a trend. And that’s what we’ve seen with Telstra. So it was really interesting. I was on The Call with Kochie and Andy Penn, the CEO of Telstra a couple of weeks ago and we’re talking about the Telstra result, and it was a great result. Market was really upbeat, sent the share price quite a bit higher on the day.
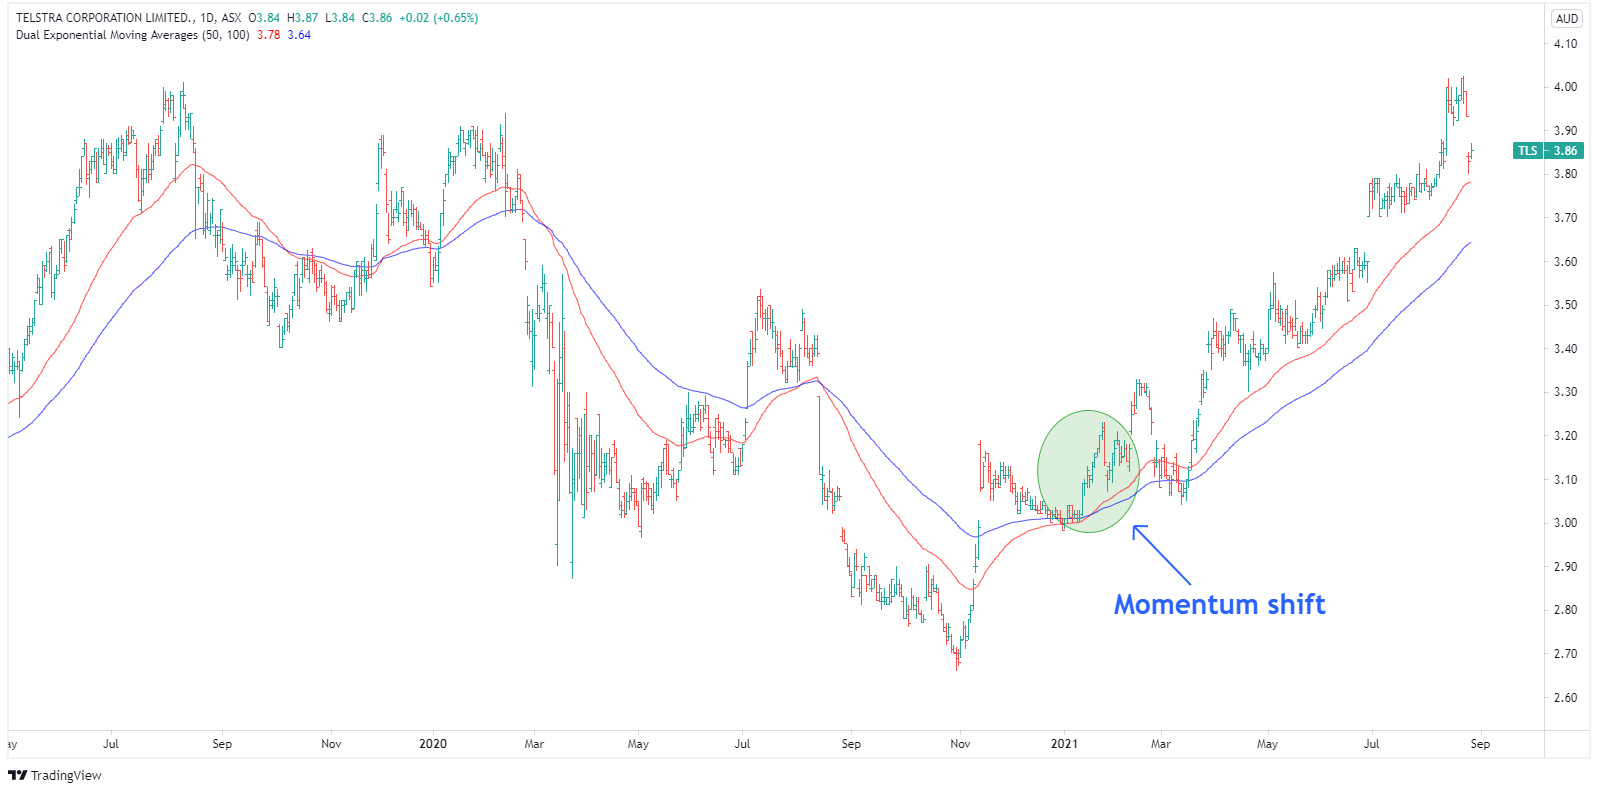
But the interesting thing is that the momentum shifted in Telstra all the way back in February so you can see where I’ve got the shaded area on the chart. So for me, the momentum turns when the moving averages turned. So I’m looking at 50 and 100-day moving averages. You had that cross-over. You had the break up to a new high, so that was the key shift for me and then the news flow since then, it’s pretty much validated that trend.
Another interesting thing to note with Telstra is the $4 level. So $4 is a bit of a bit of a key pivot point with Telstra, it has been for years now, so I’ve got a chart on that:
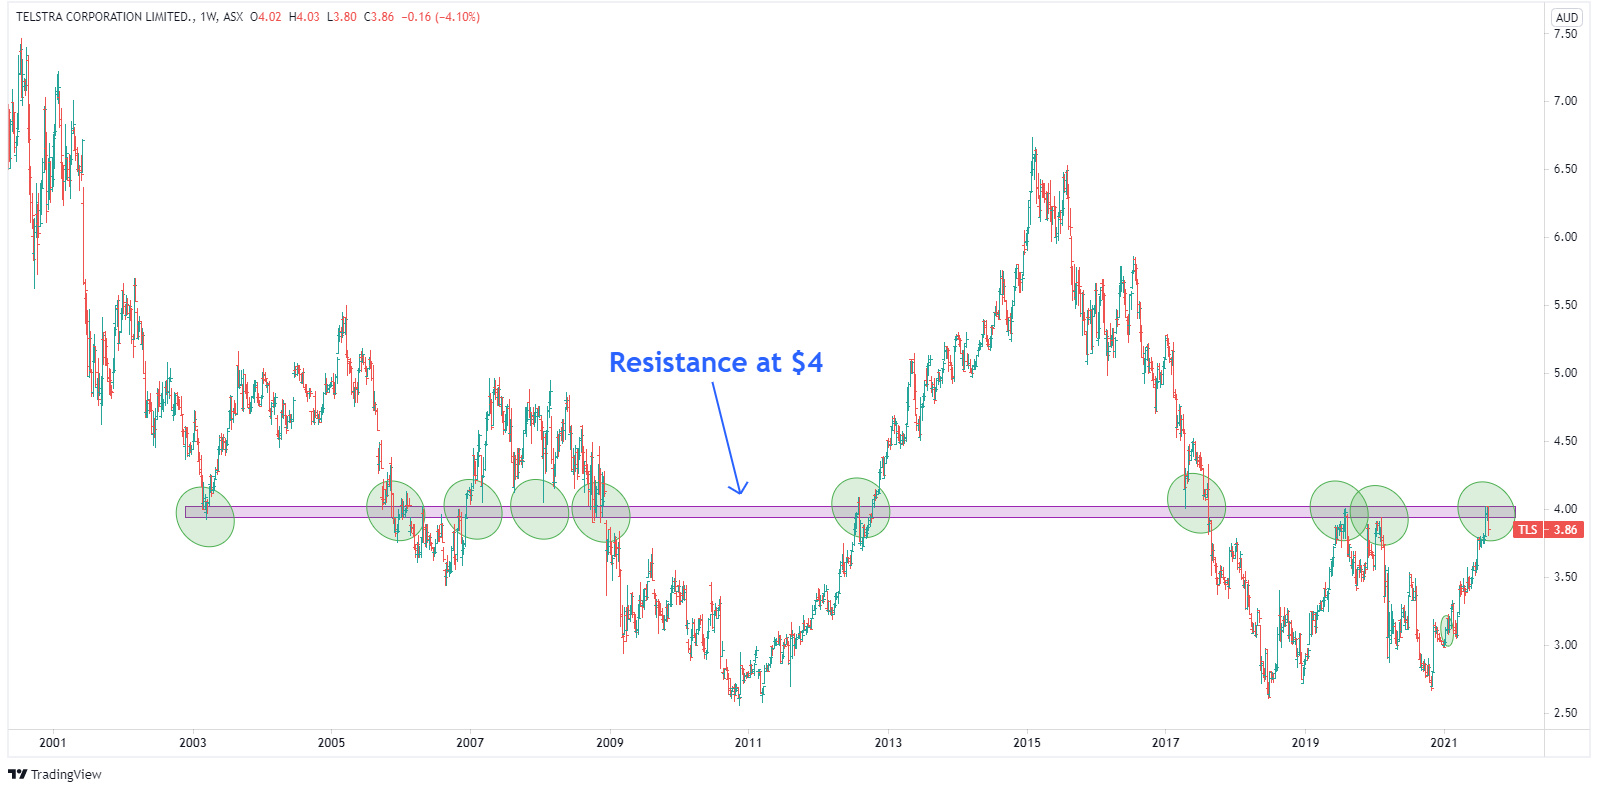
And you just look at this chart here and you can see that sometimes the price here is $4 and reverses direction. Other times there’s a bit of turbulence around that $4 mark before the market then moves through it, and the point I made a couple of weeks back was, look, we’re up at $4 now, so there’s a good chance the market may pause here. I think it will go through because I think the overall trend is strong. I think the market overall direction is positive, so I think we go through. But you expect a bit of consolidation there, and that’s what we’ve seen. The shares went ex-dividend yesterday. So that has resulted in a bit of that pull back as well. But nonetheless, it has been pausing at $4. So I think for the next leg up, we want to see that $4 break. And that will be a really good positive for Telstra should that happen.
Host: All right, all eyes on that $4 mark then. Jason, now Adacel Technologies is another one that you’re looking at. I know that you’re looking at a cup and handle formation here. Walk us through the levels. What? What are you seeing?
Jason: Yes, so it’s one of those stocks, which most people won’t probably know much about, only has a market cap of $100 million. And like the only reason I came across it is because it turned up in my momentum scans. And so what they do, it’s all about air traffic management technology. So whilst you don’t know the name, chances are you’ve flown through air space that uses their technology. It’s another example of news flow validating the trend. So they had a really good profit result a couple of weeks ago, the profit before tax was up about 250%. So great result. And that’s what’s caused that spike higher on the right hand side of the chart. I’m using the algorithms to find these stocks. But my training back in the day when I started out was all in technical analysis in the charting room. So I love looking at a chart and looking for the patterns. And so whilst I use algorithms to find these stocks nowadays, I still like that old school analysis of looking at the chart and seeing these formations.
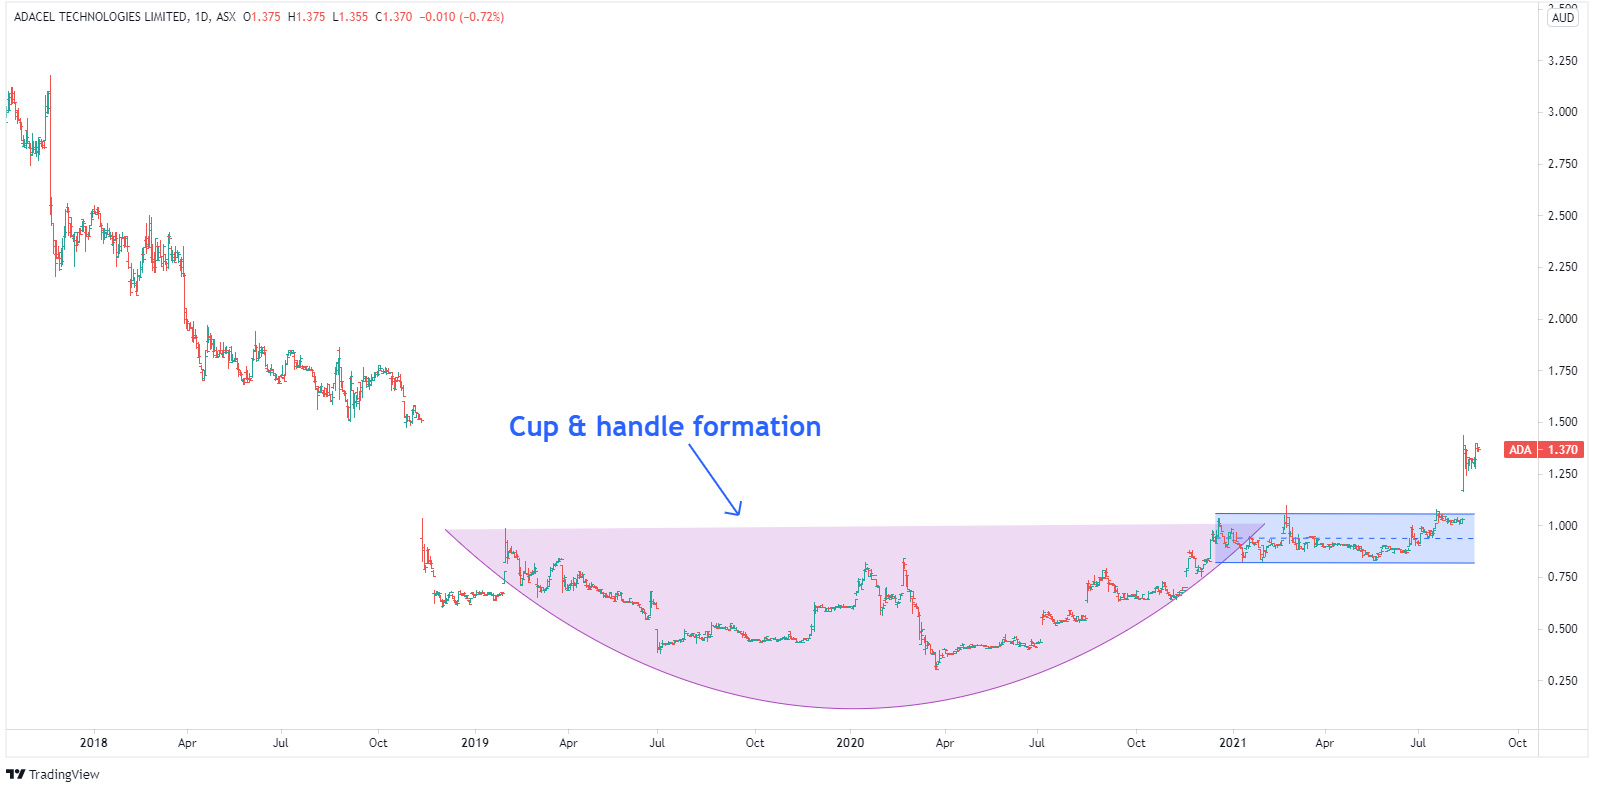
So this is your classic rounding bottom, and another variation of that is the cup and handle. And so the handle part is that sideways movement we’ve got after the rounding section and that often forms when the price gets back up towards previous highs. You’ve got people who bought around those highs. They come in and sell. This puts a dampener on the price and settles it down for a bit, and then once that selling is absorbed, the price breaks higher. So that’s what we’ve seen here. So it’s nice when you see those classic formations coming in supporting what I’m doing with the algorithms.
I’ve got another chart on Adacel which is worth looking at because it approaches it from a different perspective.

Price breakouts are really interesting, because a lot of people will see a market gap higher and they go well, look, I’ve missed it. It’s too late to buy. I also don’t want to buy here because it might quickly reverse. What actually happens, though, is often the opposite. These gaps higher can actually be really good buying opportunities. The key is you’ve got to look for the volume and you want to see high volume accompanying the breakout and the price. So what I’ve done in this chart, you can see the shaded areas at the top, and they’re highlighting the gaps higher in Adacel. And this is a stock which is actually predisposed to these gaps higher. And then below that, you can see where I’ve circled the volume and you’ll see that the breakouts on this stock accompanied by really strong volume, like significantly higher than what had previously been happening in the days and weeks beforehand.
So again, for me, it’s all about the algorithms. But I like coming back to these classic charting techniques and seeing them validate what I’m seeing in the momentum scans that I do. So look, this is a stock, which I think probably has quite good upside potential from here. And look, it’s gonna be an interesting one to watch over the next few months I think. It’s one of those ones that could go quite a bit higher.
Host: All right, Adacel Technologies it is. Jason, let’s finish it off and have a look at your last stock for the trade today. This is Kleos Space now, a possible flagging formation I can see there. So what levels should those traders be looking out for? Where is that break?
Jason: Yeah, so this is a little bit different to the Adacel type where you’ve had that big breakout. You can look at this chart from two perspectives. The bearish scenario is that it’s starting to lose momentum, maybe starting to roll over, the moving averages maybe starting to flatten and then turn lower. But then on the bullish side, well, there’s a potential that we’ve had a run up, and now we’re getting a bullish flagging formation. And what I like about this chart is that the levels are so clear, and it’s really this is one of the best asymmetric opportunities that I’m seeing.
And just to clarify, so I’m not saying it’s a high conviction situation. But it’s asymmetric in that the risk looks relatively minor compared to the potential reward. So the way this plays out for me is that I look at that support zone at around 87-88 cents, that’s quite clear. That encompasses some previous lows, and a previous high point, also comes in around that 100 day moving average.

On the upside, the breakout point is around 97 cents and the price is currently around 94 cents. So it’s one of those trades where you probably have around 10 cents of risk per share. But the reward on this, it’s like this is one of those stocks involved with geospatial technology, it’s a huge market with a lot of upside potential if they can execute this strategy and get it right, so it’s one of those stocks which could run $1, $2, even more over time. But this is an entry point where you can potentially get in for 10 cents risk.
So even it’s got a 40% chance of actually being successful, if you play that sort of risk reward 10 to 1, every day, you can you bat a 40% average and do really well. So, look, it’s an interesting stock. It will be an interesting one to keep an eye on to see how it plays out over the next few months.
Host: Yeah, well, that’s what we like, upside potential. Jason, quickly, is it in your portfolio Kleos Space?
Jason: Yes, I’ve got that one. I’ve had it for a while because we’ve had that upward momentum for a several months. So I wide-trailing stops. I was talking about a tight entry point, but for me it’s using a wider trailing stop, trying to capture those big medium-term trends. So if the stock does run $1 or $2, if you’ve got a wide trailing stop, you’ve got the potential of staying in there. If you’re batting for the short term gains, it’s a lot harder to get. It’s an interesting stock, but it’s one of those ones where you don’t invest all your capital in it, and it’s one of many stocks in the portfolio. So if it runs, it’s fantastic. If it doesn’t, you just chalk it up as one of those forgettable trades as you move on to the next opportunity.
Host: Jason, I always love chatting charts with you. That was Telstra, Adacel Technologies and Kleos Space for today on the charts. Thanks so much for joining us. It’s been a pleasure, as always, thank you.
Meet Jason

I'm Jason McIntosh, the creator of Motion Trader. My career began in 1991 on the trading floor at Bankers Trust. Nowadays, I trade my own systems from home in Sydney.
Motion Trader is for investors who value robust analysis, data driven entry and exit signals, commentary, and education. I use engineered algorithms to identify when to buy and sell ASX stocks. No biases or guesswork, just data driven signals.