How to Buy Small Cap Stocks [And Beat ETFs]

By Jason McIntosh | Published 19 April 2022
Many investors want to buy small cap stocks with the aim of outperforming. And while smaller stocks can produce big returns, it’s not as simple as buying a small cap fund and sitting back.
Take the ASX Small Ordinaries Index for instance. It’s a grouping of smaller stocks within the ASX 300 (it excludes the largest 100 companies).
Here’s a chart:
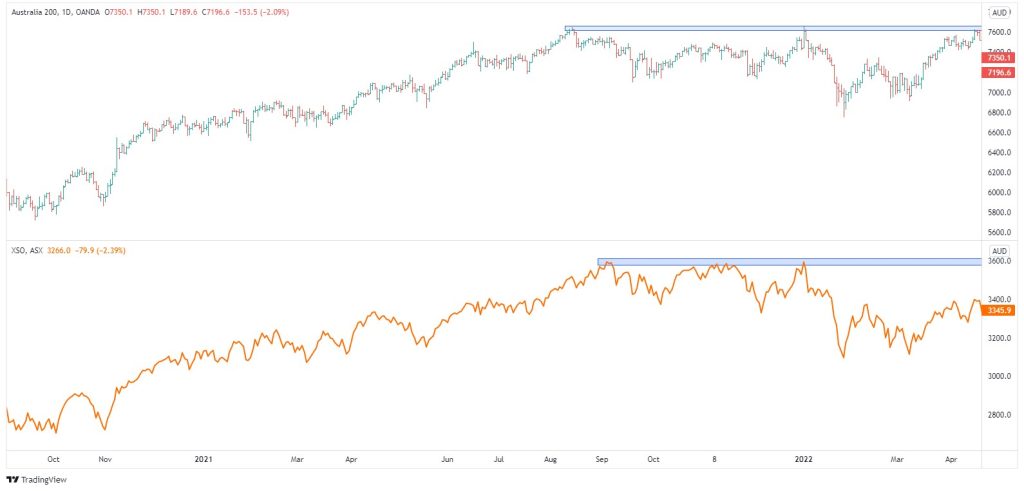
Looking at the last 18 months, the Small Ordinaries (bottom chart) has been underperforming the ASX 200 (top chart). You’ll see a resistance band on both charts at the all-time highs. While the ASX 200 is just below the previous highs, the Small Ordinaries would require a rally of around 7% to get to the equivalent level.
The Small Ordinaries is also teetering at the point where it could fall back below its moving averages (see video). It simply doesn’t look as strong. There are stocks within the Small Ordinaries that are doing exceptionally well. But there are others that are holding it back. This is why I think stock selection is so important.
Many investors buy a Small Ordinaries ETF to get small cap exposure. This provides a basket of stocks across the entire index. With this approach, an investor gets the best stocks, and the worst.
Rather than getting blanket coverage via an index ETF, I’d rather buy the components that are doing well. Imagine how much better the Small Ordinaries could look if you had a strategy to exit or avoid the stocks that are doing poorly.
Here’s a chart of the Small Ordinaries going back to October 2015:
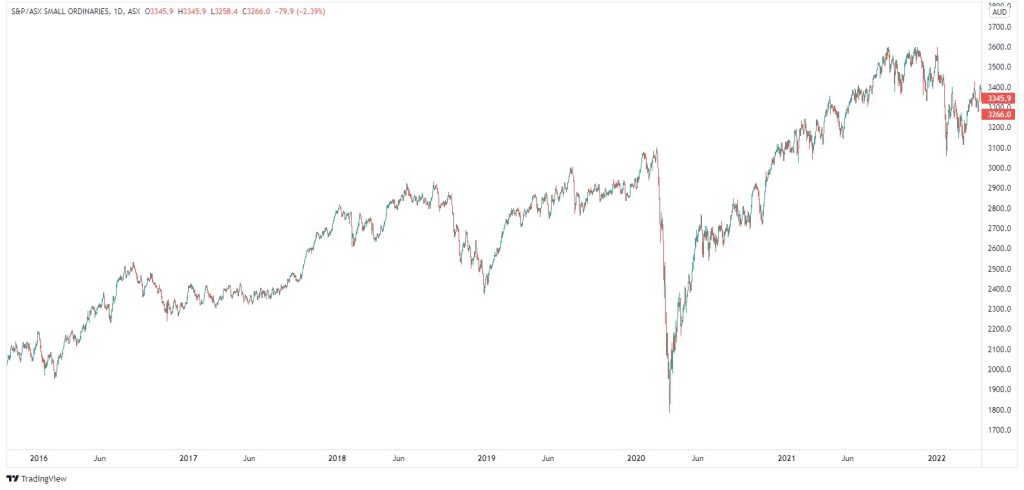
The index is up by about 70% over the last 6.5 years. That’s an average of around 10% per annum. So that’s pretty good, and that’s before dividends. This means the Small Ordinaries has been a well-performed market over the period.
But I want to show you the difference that stock selection can make. Rather than just buying a whole index worth of stocks — getting the good and bad parts — I want to show you the difference a strategy for stock selection can make.
Have a look at the chart:
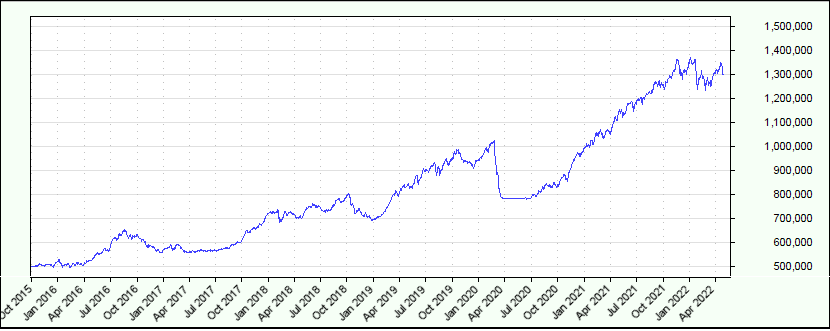
This is the simulation I use for managing my personal portfolio… this is where I get the stocks that I buy, and the stocks that I sell. The chart goes back to October 2015, around the same time I just measured out the performance of the Small Ordinaries.
The main difference is that I’m focusing on smaller stocks. But not just any small stock. I’m not buying a stock just because it’s small or just because it’s in the particular index. They’ve got to meet particular criteria.
For me, it’s all about trend-following characteristics. They’ve got to be trading above their moving averages (50 and 100-day)…. they’ve got to be stocks which are rising, so I’m buying with the trend…. they can’t have an excessive volatility profile… and then it’s about giving them wide trailing stops so they have plenty of room to run.
And that’s how I’m able to hold onto some of these stocks that go up by big triple digits percentages. My best performer is currently up by over 800%. Then there’s a host of others that are up by 100% to 400%. That’s where all my gains come from.
These stocks well and truly pay for the losses… the ones that don’t work out, which are all part of the strategy as well. It’s not about every trade being a winner. You get those losses, too. But overall, my stock selection process is helping me outperform the index.
The simulation is up close to 160%, compared to around 60% for the Small Ordinaries. This averages out to nearly 25% per annum, or about two and a half times more than the index.
And it all comes down to selling or avoiding the stocks that aren’t working. For example, stocks that are stuck in ranges or in downtrends. And buying and holding the stocks that are trend upwards.
It’s essentially cherry-picking. You’re taking the best part of the market. And that’s what I do with my Motion Trader subscription service. It identifies stocks that meet the entry criteria and calculates an exit level to get members out when it’s time to sell.
Let me give you an example of the sort of chart profile that Motion Trader avoids.
It’s a stock that’s been in the news recently:
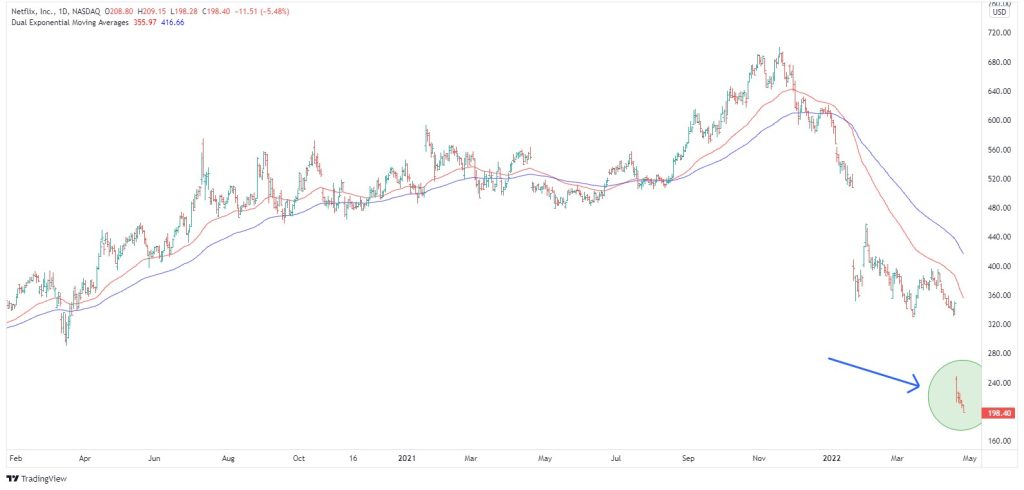
This a chart for Netflix (NFLX). Now, Netflix isn’t a small stock. It’s not a stock which I’d consider for my portfolio. It’s also not an ASX stock. But it’s the pattern I’m most interested in. It’s a sort of pattern that’s common to all types of stocks, big, small, middle, mining, tech, value, you name it.
This sort of pattern is typical of all types of stocks, and I’ve been saying, if you’ve been following my work, you’d know that I’m always talking about avoiding stocks that are below their 50 and 100-day moving averages. Many people believe this is the time to “buy the dip”. But as I often say, all the bad stuff happens when a stock is below the moving averages.
And sure enough, bad stuff happened to Netflix. It was down more than 20% in a day. This is the risk of trading against a trend… it’s the risk of buy dips, and trying to buy stocks which are below their moving averages. You run the risk of catastrophic downside.
Bad things can happen to stocks near their highs as well. But the most vulnerable part of the stock cycle is when the price is below the moving averages.
So these are some of the things Motion Trader does. It focuses on stock selection and stock exits. And the aim is to put the odds in my favour, and of course, in your favour as well.
Looking for the best ASX stocks to buy now?
Motion Trader‘s algorithms scan more than 2,000 ASX stocks daily in search of medium term investment trends. We then tell our members precisely when to buy shares. And most importantly, we tell them when to sell.
Try a no obligation FREE 14-day trial of Motion Trader, and see what an algorithmic trading approach could do for you.
Meet Jason

I'm Jason McIntosh, the creator of Motion Trader. My career began in 1991 on the trading floor at Bankers Trust. Nowadays, I trade my own systems from home in Sydney.
Motion Trader is for investors who value robust analysis, data driven entry and exit signals, commentary, and education. I use engineered algorithms to identify when to buy and sell ASX stocks. No biases or guesswork, just data driven signals.