Why Smart SP500 Money Is Playing Defence | Episode 125
Where is the Stock Market Heading?
00:00 Intro
00:30 SP500 closes in on resistance. Watch for this next.
03:20 The ETF you should monitor closely (and why)
05:50 Watch out for vulnerability in this key group of stocks
08:06 This is the biggest disconnect at present
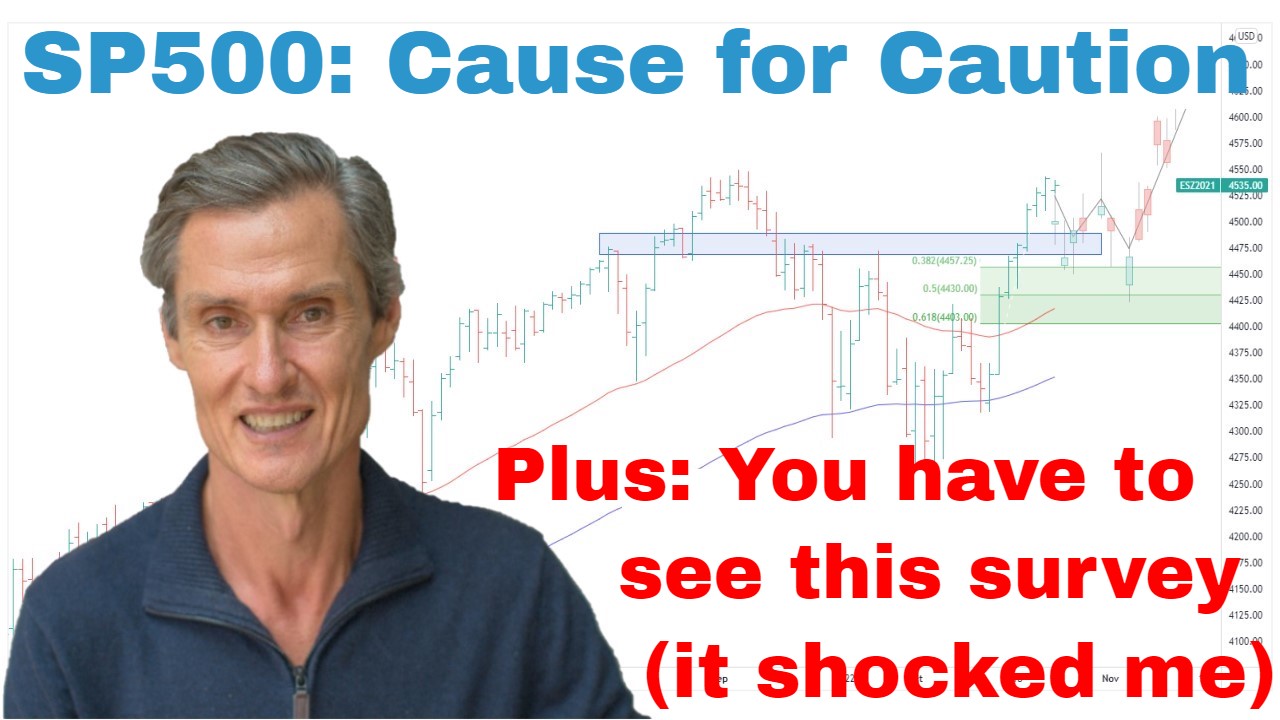
08:55 You have to see this fascinating survey (it shocked me)
Transcript
Please note: Charts available from video
This video is going to focus on the S&P 500. I’m going to cover the ASX 200, gold, and uranium in a separate video. You can get that video here. I’m also going to show you the part of the market which makes me the most worried, so make sure you stick around for that. As always, this is general commentary. It doesn’t take your personal situation into account. With all of that said, let’s get into our first chart.
So, starting off with the S&P 500. And there’s actually not a whole lot to report this week. It’s been a fairly quiet week, not a great deal of price movement at all. We’ve really seen the S&P 500 testing the upper end of this trading range. You can see these blue parallel lines. This is a downward-sloping trend channel which is type of a trading range. And we’ve been testing the upper boundary of that for the last couple of weeks.
And another thing to note is another resistance point at around 4200 which we’re right up nudging beneath just at the moment. So, this is an interesting area, this 4200. You can see it’s been technically active from June. You can even go further back. But just for the sake of this, I just want to focus on the most recent touchpoints this 4200 area has had. And we’re right back beneath it now.
So, I think with the loss of momentum just over the last couple of weeks and the proximity to a double layer of resistance, I think that just increases the odds that we’re going to get some sort of a pullback. Some pullback might develop over the next week, maybe the next couple of weeks.
It just doesn’t seem to me an asymmetric point to be adding to positions in the S&P 500 at the current time. I think this 4200 level, I think it’s a big level. I think it’s an important level. And for the market to…and this is if, of course. If the market is to get through it, I think it might need to do a little bit more work. It would be a case of some more back and forth, build up some energy, and then potentially the market then has a go at punching through the resistance. Whether that even happens, we don’t know, but it just doesn’t seem at the moment to have the energy to break through this 4200. If a pullback does happen, I think the first thing we want to do is just keep an eye on the Fibonacci retracement.
So, just let’s use the March low and this week’s high. And if we were to get Fibonacci-type retracement, it brings us back to around where these rising moving averages are. That’s the upper end of the Fibonaccis. We’d potentially come back to around these rising moving averages which could potentially be quite constructive. But we need to see how that price action plays out. Of course, different scenarios could come into play, but at the moment, it’s watching this price action, seeing how it develops, working out where’s asymmetric for entries and where’s not.
Now I want to show you an area of… I think an area of uncertainty in this current market is when we look at the S&P 500 on an equal-weighted basis. So, this is basically the S&P 500 on an equal-weighted basis. It’s right in the middle of its trading range. And that really doesn’t give us a great deal of direction whatsoever. What I want to do with this, it’s I want to add… This is an interesting comparison to make with this. I’m going to overlay a chart of the S&P 500, the capitalization-weighted S&P 500, and I’ll tell you what I see when I look at this. So, let’s just line these up. So, normally, you’d see these two markets to be moving. They move pretty much, not quite in lockstep but there’s a very high correlation.
What we have at the moment, we have a situation where the equal-weighted is nowhere near its February high, whereas when you look at the capitalization-weighted, it’s actually not too far. It’s not far from breaking above this February high, particularly when you put it on a high-low close basis rather than just closing line-based graph which I’m using. So, it’s potentially setting up divergence and it’s really graphically you can see that all the action seems to be in the big cap stocks. And that’s something that worries me. It’s the big stocks doing most of the work. So, I think we can’t ignore the underlying trend in the S&P 500. But I think it’s something to be aware of that it’s really currently at the moment being driven by those larger stocks. I really want to see broad-based participation to get some confidence that this market does have the potential to really do some good trending on the upside.
Now, if you’re getting some value from this, please hit that like button. Please leave a short comment, just “Hey, thanks for the video.” It tells YouTube you’re watching, YouTube shows other people, and that helps me heaps. And hit the subscribe button if you haven’t already to get notifications when I do these videos. Of course, visit me over at motiontrader.com.au.
Now let me show you something else. And this is the Russell 2000. So, this is similar to what we were saying in the S&P 500 equal-weighted in that the smaller stocks, the smaller to mid-cap stocks, they’re just not participating at the moment. So, the Russell is just sitting here below the 50 and the 100-day moving averages. Been sitting below there for several weeks. And it worries me when a market sits below declining moving averages. That’s always a point of vulnerability. All the bad stuff tends to happen when a market is below moving averages. That’s not necessary to say market has to decline. The market, of course, at some point bases below moving averages and turns higher. Maybe what this is, maybe this is a big basing formation, but nonetheless, we do need to be aware that this is a point of vulnerability.
At the moment, it actually looks like… It’s looking like some sort of a little flagging formation where we’ve had a decline on the market and now we’ve got a sideways consolidation. It does open the risk that the market breaks to the downside from that pattern. That’s out of sync with what we’re seeing in the S&P 500. So, it just adds to the uncertainty of this market. And, of course, this breakdown may, of course, not happen. This could continue to turn higher and then it starts to give us some more confidence that the market maybe it can continue to run. But at the moment, as I say, it’s out of sync with the S&P 500 and also the NASDAQ 100. Price action I would have liked to have seen from that March low would have been more like a stronger rally. And then we get a flagging formation from a higher level, and from there, it sets the stage for a push higher. But, of course, that’s not what we have. We didn’t get that type of price action. And it’s a case of we’ve got to play the price action that we have, not the price action that we want. So, keep a close eye on this I think at the moment.
And just finishing up, this gives us a similar picture but on a smaller stock level again. It’s the iShares Micro-Cap ETF. We’ve got a situation where we’ve got a market which is just sitting on its lows below moving averages. It’s close to making new lows, these small caps. Small caps shouldn’t be so out of step with the big charts. So, for me, this just doesn’t present a clear picture. So, I think this is just not a time for big bets in either direction. I’m conservatively long. I remain conservatively long whilst the price action is supportive of that. But whilst we’ve got this disconnect, I’ll keep plenty of cash on the sideline.
Now I just want to finish up with a really interesting chart that I saw this week. It’s going to add more confusion to the picture. Now, this is from a survey from J.P. Morgan’s strategic research. Turned up in my Twitter feed during the week. The question asked, “Where do you see the S&P 500 at year-end?” At the end of the year, where do you think it’s going to be? Look at the responses, below 3500, 4000, 4250. So, the market at the moment is just testing 4200. Only 5% of people, let’s say 5.5% of people see it above current levels, which I think is just absolutely extraordinary. So, I don’t know the sample size, I don’t know who they’ve asked, but that is a massive proportion of people expecting the market to be lower. So, the contrarian side of me says, “I want to be cautious on the long side,” but I’d be worried about being an outright bear as well with so many people on that side of the boat, according to this survey.
So, let’s call that a wrap for this week. Thank you for joining me. Hopefully, you found it interesting, and I look forward to coming back and talking to you next week. Until then, bye for now.
Please see video for more detailed analysis and charts
Looking for the best ASX stocks to buy now?
Motion Trader‘s algorithms scan more than 2,000 ASX stocks daily in search of medium term investment trends. We then tell our members precisely when to buy shares. And most importantly, we tell them when to sell.
Try a no obligation FREE 14-day trial of Motion Trader, and see what an algorithmic trading approach could do for you.
Meet Jason

I'm Jason McIntosh, the creator of Motion Trader. My career began in 1991 on the trading floor at Bankers Trust. Nowadays, I trade my own systems from home in Sydney.
Motion Trader is for investors who value robust analysis, data driven entry and exit signals, commentary, and education. I use engineered algorithms to identify when to buy and sell ASX stocks. No biases or guesswork, just data driven signals.