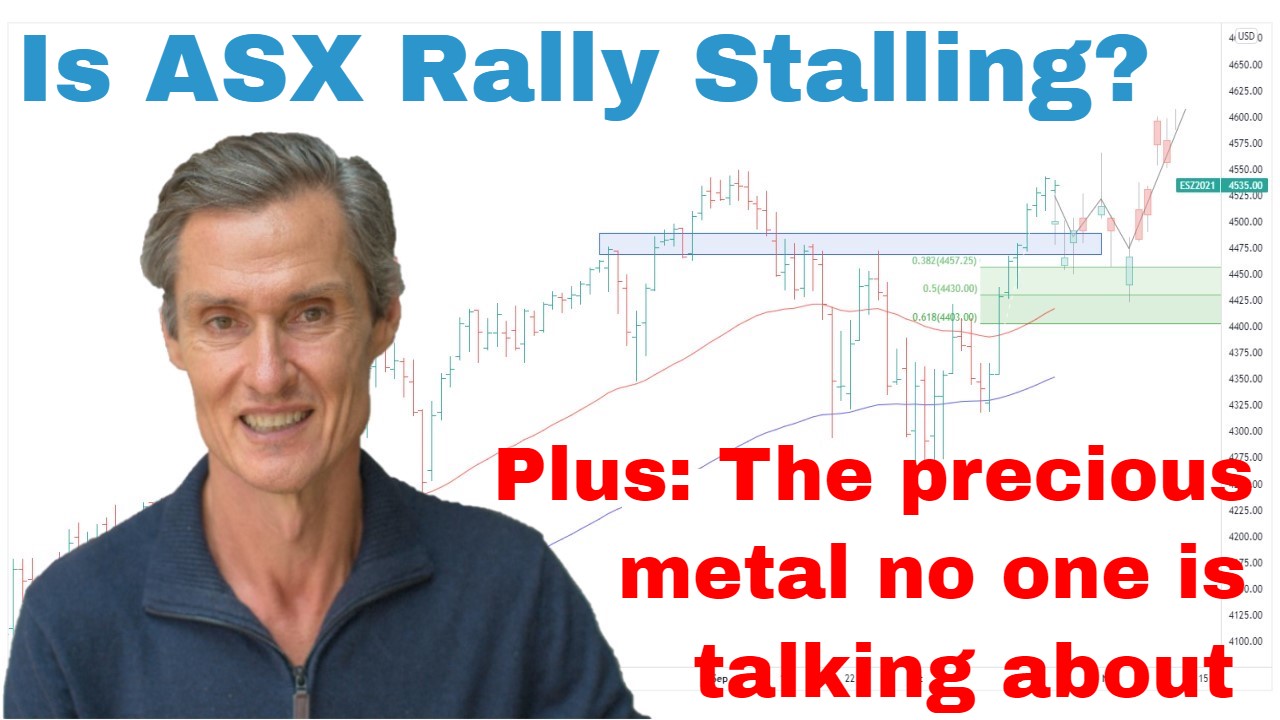
Is The ASX 200 Setting-Up Like 2011 | Episode 124
Where is the Stock Market Heading?
00:00 Intro
00:30 Is the ASX 200 about to stall? (Watch for this)
02:44 Range bound markets are a battlefield. This is what you need to know.
06:08 Here’s my view on the Small Ordinaries (and what I’m doing)
08:00 How far could gold pullback?
10:33 Look which forgotten precious metal is breaking higher (it’s not silver)
12:30 This is the current risk in uranium
Transcript
Please note: Charts available from video
This video’s going to focus on the ASX 200. I’m also going to have a look at gold and uranium, so make sure you stick around for that. You can get that video here. As always, general commentary. It doesn’t take your personal situation into account. With all of that said, let’s get into our first chart.
So, ASX 200 up on the screen. And it’s been a pretty quiet week in the local market. Not really a lot going on. Very similar to the S&P 500. And I think that this is possibly the pause now, the consolidation that I’ve been speaking about for the last couple of weeks. It looks like maybe it’s starting to kick in. And that’s just… It’s typical you get these pauses after a market has a run up through the moving averages, runs above it, often get a pause, consolidation, pullback. And that may be what we’re seeing get underway now. It’s important to remember that from this low four weeks ago back in March, the market has run, the ASX 200 has run 8%. So, it’s a big rally. It’s a big rally in a short space of time.
Ideally, what we want to see now, if this pullback does continue to unfold, we want to see the dip being supported. We want to see buying come in, buy the dip type of price action as the market potentially pulls back towards these moving averages. So, as always, I’ve got the 50 and the 100-day moving averages, which are currently rising, so that’s a positive.
And we can also put on some Fibonacci retracements to give an idea of what could happen if this pullback continues to unfold. And you see the upper bound of the Fibonaccis coincides with around where the moving averages are. This isn’t a target level by any stretch, but just gives you an idea of the proportions, gives you the idea of what a proportional pullback to that previous rally, what it could look like. We could see the market come back towards 7200 over a couple of weeks. May not do that. It may be a shallow type of pullback that just stops above the 50-day moving average. Of course, something else entirely could develop, but let’s watch the price action. At the moment, it’s encouraging, but it does look like a pause could currently be getting underway. But any which way you look at it, this remains a range-bound market. It has been so for 18 months.
And as I’ve said before, range-bound markets are just a battlefield. They’re difficult for everyone. They’re difficult for those who think the market’s going to fall further because they hadn’t had these snapback rallies. And they’re difficult for people who want to look forward to the new bullish phase because you also then get these big downdrafts. So, trading ranges are notoriously difficult, and they can take time to play out. This is a key thing to keep in mind. Corrections, consolidations, they don’t just work in terms of price, they also work in terms of time. You’ve got to give them time proportional to the time or talk of the distance traveled in the previous upward phase.
So, I’ll show you what I mean. What I want to do, I’m just going to jump over to a weekly chart for the ASX 200. And I’m just going to compare this with a previous period in time. I want to look back here. I want to look back to 2009 to 2012. And what we had in that period, this rally off the low, off the GFC low, that was a 62% rally. Market rallied 62% in maybe about a 12-month period. It then went through two years and two months’ worth of consolidation. And this was a zigzag. It was a zigzag correction rather than a trading range like we’re currently in. And I remember this time it was a difficult period. During 2010, we were looking for the market to potentially reengage with the upward trend that began in 2009. There was another leg lower, it took more time to base, turned higher. As I say, these things take time, and that’s an example of time.
Now, have a look at the most recent rally off those COVID lows. It’s a big rally. Actually, it was a 77% rally over about 18 months. And now we’re in the consolidation phase. So far, it’s been 18 months of sideways. But just looking back at this previous experience, you can see how we got the zigzag correction. And this isn’t a prediction by any stretch, and these things never play out the same way. They’re always different. It’s just to give you an idea of the type of thing that can happen, and why trading ranges are difficult, and why they take time to do what they do.
It could be a case of maybe something like that plays out over the next six months. Not a prediction by any stretch, but it just shows how big moves lead to big consolidations, big moves, big consolidations. You’ve got to just let them play out. You can’t fight them. Wait for the signals. Wait for the breaks, and you just got to ride them out. We don’t know how this one’s going to play out. We don’t know when the eventual end’s going to come, but we do know that consolidations typically lead to big moves and new upward trends. So, it’s a case of being patient and riding this through.
Small ordinaries. Let’s have a quick look at that over the last week. So, just jumping over to the small ordinaries. Again, still range-bound. We’ve had a nice strong rebound off the lower end of the range over the last few weeks. We’re starting to see a little consolidation now. Let’s see how this plays out. I’m leaning towards this being a basing formation that’s taken shape over almost the last year now, probably about 10 months’ worth of potential basing, but there’s still a lot of work to do before we could say that this market is breaking higher. There’s plenty more resistance points. It’s a trading range. It’s about being patient. It’s about waiting for the right setups.
I’m currently seeing some interesting setups appear through my daily scans. But again, be patient with them, and wait for the right ones. You don’t need to swing at everything. It’s a case of letting the right stocks come to you, and playing at those, not just saying, “I want to be involved. I’ve got to buy something.” Keep your cash safe until you’ve got the right opportunities. It really is as simple as that. And then protect your capital with risk management should those opportunities not play out as you were expecting. That’s what I’m doing.
Now, if you’re getting value from this, please hit that like button. Leave a short comment, just “Hey, thanks for the video.” It tells YouTube you’re watching and YouTube will show other people, and that helps me a heap. So, please do that. And hit the subscribe button if you haven’t already, and visit me at motiontrader.com.au, and maybe take up that free trial, and see some of these setups, which I’ve seen come through in the signals at the moment. There’ll be some interesting stuff that you might not have otherwise come across.
Now, let’s go and have a quick look at some of these commodities. Let’s begin with gold. Interesting week in gold. We’re now starting to see a bit of a pullback develop after this strong rally we had from the February lows. I’ve been talking about the potential for a pullback for I think three weeks now. I started talking about it back in late March, and the market continued to push higher. The closer we got to this overhead resistance, this big double top resistance around 2000, just below 2100, it really got to the point where the asymmetry in buying into gold really started to dissipate. I don’t like to buy a market right below a big overhead resistance. It does open… Sometimes it’ll go straight through, but more often than not, markets tend to pause before breaking through big levels.
And the situation in gold now, if I just put those… Let me just put some moving averages on this chart. And it’d be quite common at this point to see… Also, put some Fibonaccis on. That also helps frame up the situation. It wouldn’t be at all unusual to see this market travel sideways for several weeks. Maybe making its way back towards the Fibonacci region, which also coincides with where the 50-day moving average is coming up, 100-day would be moving into the Fibonacci region before too long. That would certainly be quite a viable and possible scenario that we could see develop.
The gold stocks I have in my portfolio, I’m holding. I like the longer-term picture. I think it looks good. It’s just a case of when we can look at the potential for a break higher. Just reminding you of this earlier period. If you’ve been watching the videos, you would’ve seen me speak about this before. It’s an example of where gold ran up towards big overhead resistance, and then paused for six months, six months of consolidation before a break above. Unlikely things will play out exactly that same way again. Again, it just gives you an idea of the things that can happen. The market works on its timeframe, not ours. We might like gold. Doesn’t mean gold’s going to run now. We’ve had a big run. Quite possible we get quite a consolidation before we get the next level of excitement, break above 2080 if, of course, that happens.
Quickly, I just want to show you one other precious metal we don’t talk about that often. It is platinum. Now, I actually spoke about platinum back in…It was in early January. It was breaking up out of this triangle trading pattern. Had a breakout. The breakout failed, started to pull back. This thing happens quite frequently. Breakouts don’t always stick. It’s what risk management is all about, about cutting those positions. Nothing interesting happened for a few months, but now something interesting is happening again.
And just to frame this up, just quickly jumping over to a weekly chart of platinum. You’re seeing where this has come from, and you can see it has been in a big bearish phase for close to a decade really. Had a long period of falling prices, long period of moving sideways. Actually, looks a bit like a rounding basing formation, which has taken years to form out. And it’s just one of those interesting things which turned up, which I’ve been keeping an eye on. And jumping back to that. And you can see, it does leave plenty of upside potential. If this does happen to be a basing-type formation, it does open up a lot of upside potential in platinum.
Coming back to that daily chart. We’ve got the moving averages are trending upwards. Price is above the moving averages. It’s a harder one to play. There’s not really any pure platinum producers or stocks on the ASX but do some research. If you like the concept, do some research globally. See what you can find. A lot are based in South Africa. They’re hard to play. Anglo American is the largest producer, but they do all sorts of other things as well. But I think you’ll find there are some platinum-type opportunity to do a little bit of work.
Now, just lastly and quickly, uranium. Not a whole lot to report about this week. The range continues. The thing I’m mindful of, and I’m watching carefully, is that the price is currently below these moving averages. It continues to sit below the moving averages which, as you know, for me, it’s a point of vulnerability when a market is below the moving averages. We can also draw in a trading range that we’re currently sitting in. [inaudible 00:12:58] tell you when I draw this upper bound, but we do have a fairly well-defined trading range.
Now, is this a basing pattern, or is it a continuation pattern? So, a basing pattern would mean that we look for a situation where uranium does start to bounce off the bottom, and then turn higher again, and start heading back up towards the top of the range. However, we never know how a range is going to resolve. We could also get a break to the downside of this range, and see uranium move towards the bottom of this range.
So, the theme of this week’s video has been…particularly the S&P 500 one is that ranges are a battlefield. They’re difficult. There’s so much ebb and flow within the range, and they just do you emotional and financial damage trying to play them. So, my situation with uranium is I have a core position I continue to hold, and I probably won’t look to do any adding until and if we get a break above this upper end of the range. And that could be a while ways still. This range could persist for many more months. We just need to wait and see.
So, let’s leave that there for this week. Thank you for joining me. Hopefully, there’s been something of interest there. And I look forward to coming back and talking to you next week. Until then, bye for now.
Please see video for more detailed analysis and charts
Looking for the best ASX stocks to buy now?
Motion Trader‘s algorithms scan more than 2,000 ASX stocks daily in search of medium term investment trends. We then tell our members precisely when to buy shares. And most importantly, we tell them when to sell.
Try a no obligation FREE 14-day trial of Motion Trader, and see what an algorithmic trading approach could do for you.
Meet Jason

I'm Jason McIntosh, the creator of Motion Trader. My career began in 1991 on the trading floor at Bankers Trust. Nowadays, I trade my own systems from home in Sydney.
Motion Trader is for investors who value robust analysis, data driven entry and exit signals, commentary, and education. I use engineered algorithms to identify when to buy and sell ASX stocks. No biases or guesswork, just data driven signals.