SP500 Bears Near Breaking Point | Episode 131
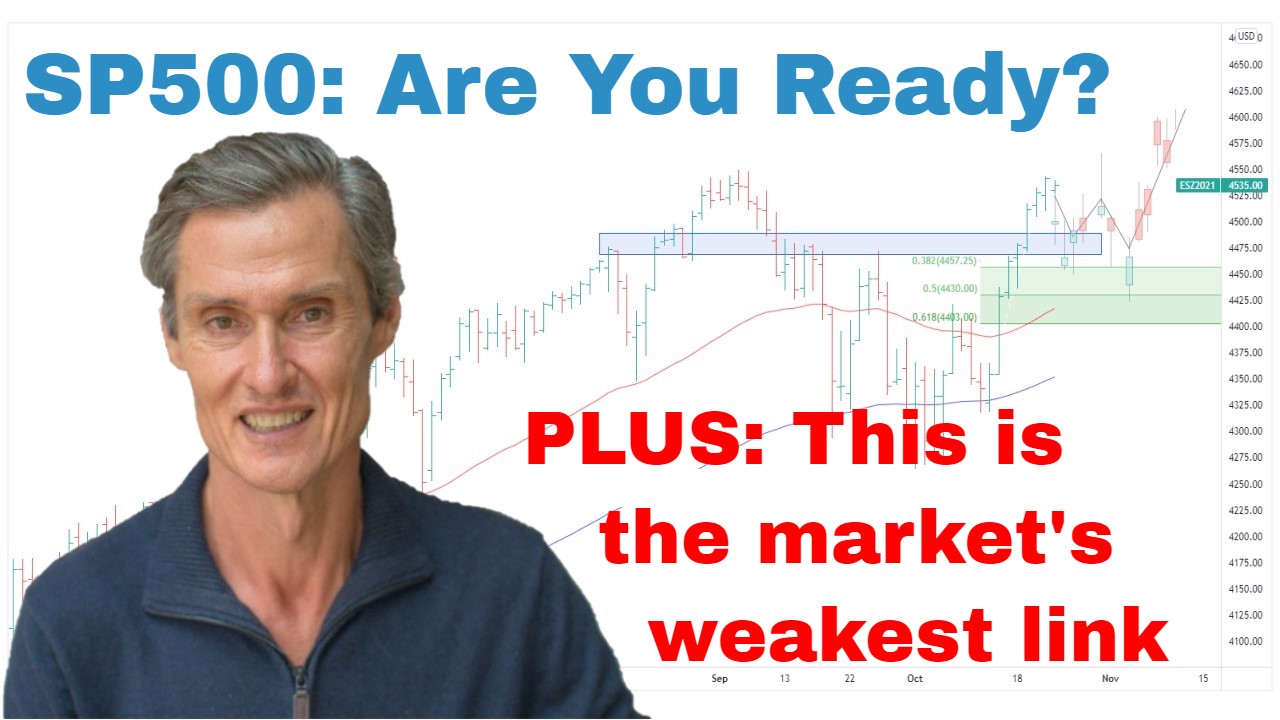
Where is the Stock Market Heading?
00:00 Intro
00:30 Why I’m making a key change to SP500 chart
05:08 Nasdaq does the inconceivable (did you think it possible?)
07:07 Look what this leading stock just did!
09:04 This key indicator highlights the market’s weakest link.
11:05 Watch what happens here closely
Transcript
Please note: Charts available from video
This video is going to focus on the S&P 500. I’m going to have a look at the ASX 200, copper, gold, and uranium in a separate video. You can view that video here. I’m also going to show you an indicator which I’m watching very closely, really important indicator. I think you’ll find it interesting, so make sure you stick around for that. As always, this is general commentary, it doesn’t take your personal situation into account. With all of that said, let’s get into our first chart.
So, I’ve got the S&P 500 up on the screen. And this really is a fascinating chart. It’s amazing how it’s been holding up so well despite all the gloom and negativity which has been thrown at it over the last several months. And I’m going to talk about the current setup in a moment, but before I do that, I’m just going to adjust the way that we’ve been viewing this chart over the last several weeks. So, I’ve had this downward-sloping trench channel on the chart and I’ve been using that to define the trading range that the S&P 500’s been in, but I’m finding that it’s starting to lose its relevance. I’ve been watching over the last couple of weeks and it’s been edging above the trend line, but it hasn’t really been…the trend line hasn’t really been adding much value. So, I don’t think this is a line we should be watching.
So, what I’m going to do, I’m going to remove it. I’m going to remove the lower boundary and I’m going to replace it with a pair of horizontal lines. And I think what this does is I think this better defines the trading range that we’re currently in. And this is one of the things with technical analysis. It’s an ever-evolving study of the market. And I think it’s important that we’re always evolving and adjusting our thinking as the price action changes, as we get new information. So, I think this is the play for the current analysis of the market.
And so we’ve got this big trading range. It’s been in place for about 12 months. Goes back to May last year. And what we’ve had over probably the last seven or so months now, we’ve got this series of higher highs and higher lows, and that’s really defined this market. And we now find that the S&P 500 is trading up at the upper end of this trading range. And where we’ve been over the last…it looks like about six weeks. We’re now in a position where the market is really starting to coil up. It’s really compressing within a tight range just beneath this key overhead resistance at 4200. And this has been the key area of focus for a while now, this 4200 level. And what I said last week, last week I was saying it looked like the market was going to probably need to pause and build some sort of a platform beneath 4200 before potentially having a retest and potentially breaking higher. And that’s what it’s been doing. I think the price action has been constructive, even though it’s been quiet. It hasn’t been doing much. I think this is constructive price action.
And I want to go over and just show you quickly on a 4-hourly chart why I think it’s constructive in that since reaching 4200 back in mid-April, there have been a couple of attempts for the market to sell off. And each of these attempts to sell off did gather some immediate downward momentum. The sell-offs were quite sharp. But what was interesting after each of those sell-offs was the strength of the rally that came back. So, that’s a sign of strong interest to buy the dip. I think that underpins the current market. And what we now have, I think we’ve got a developing platform which can be used as a launching pad for the market to try and test higher.
So, let’s just go back to that daily chart. And we’ll also note this support which comes in beneath the market at 4050. So, I think whilst the market remains above this support, I think we give the benefit of the doubt that the market will really try and test and break higher. Break below this support then we’re back into the middle of the range. We’ll reassess the situation as the price action unfolds. But at the moment, we’ve got rising moving averages, we have a price which is above moving averages, above support, and it’s starting to coil. So, I think the overall momentum over the last few months continues to be to the upside. I think the answer really is starting to favor that this will, despite the expectations to the contrary from a lot of people in the markets with their continued belief that the market has to fall, I think the odds are really starting to favor that this will test to the upside.
And also looking at the NASDAQ. The NASDAQ also gives us some clues to how things are unfolding. What’s been really interesting here is to see the NASDAQ hit a 10-month high on Thursday. I think for a lot of people, a 10-month high in the NASDAQ was very much an inconceivable possibility when we think just back a few months, just back into late January, early February when the NASDAQ was breaking upwards from this bullish wedge formation. And overall, this looked to be like potentially a large basing formation. And when we got the breakout, I mentioned that, well, when you get a breakout from a wedge, a wedge will often move back up towards the top of the pattern, the starting point for the downward trend line from the top of the pattern. And we’re now getting pretty close to that point. So, that would have been a pretty inconceivable idea back at the time for a lot of people to take on board.
But I think this is just a really good example of why I think it’s so important to follow the price action, not the headlines. The headlines the whole way up has been about recessions and interest rates and inflation and bearishness all around, but it’s the price action which has been really giving the best signs as to how to be positioned within this market. And on the surface, I’d still say this looks like an encouraging chart structure. As I was saying, we’ve got the breakout from a basing pattern, higher highs, higher lows. We’re above rising moving averages and making new highs. So, they’re all ticks for a rising trend. That’s the building blocks of an uptrend, all those factors.
And then you look at a stock like Google. Just in the last couple of days, this has been a really interesting one. I spoke about this, I think it was last week or the week before, and I talked about how we had this tight compression trading range, and it was just above these rising moving averages. And it gave the impression that the momentum was going to push this to the upside and we would get a breakout. And that’s very much what we’ve seen. We’ve seen a breakout in Google to the top side.
And just looking at the volume. You can see I’ve got volume down here below. Look at the amount of volume which has accompanied the breakout. So, that really gives extra validity to the upward break, and I think it’s a sign of institutional buying which is really starting to push this stock upwards. And so when you look at this, when you look at a stock like Google, you look at the price action we’re seeing, I think this isn’t the way a market sets up just before it goes into crash mode. In fact, I’d suggest that the price action we’re seeing in Google is more likely to support the possibility that the S&P 500 breaks higher over the near term, maybe over the next couple of weeks. Who knows? It hasn’t happened. I’m not predicting it’s going to happen. I’m not preempting it’s going to happen, but that’s the way the probability seems to be lining up.
Now, I want to have a look at some of the other…I want to have a look at the other side of the story in a moment. But before I do that, if you’re getting some value, please hit that like button. Please leave a short comment, just, “Hey, thanks for the video.” It tells YouTube you’re watching and engaging, YouTube shows other people, which helps me immensely. So, please do those things, like, and comment. And also subscribe. Hit that subscribe button if you haven’t already done so, so you can see my videos on a more regular basis.
Now, let’s have a look at something else. I want to show you something, an indicator which I’m watching carefully and closely. This is the number of NASDAQ 100 stocks which are trading above their 50-day moving average. And I’ve spoken about this type of thing over the last month. And it remains a point of concern in that… So, I was just talking about how the NASDAQ’s been making a series of higher highs and higher lows. That’s not the same for the number of stocks above their 50-day moving averages. In fact, the number of stocks above their 50-day moving average has been declining over the course of this year. So, we’ve got this divergence. We have an index which is rising, or NASDAQ and S&P 500 which is rising, but we have the number of stocks participating in that rally declining.
What is interesting when I look at this is we have this coiling pattern within the number of stocks above their 50-day moving average. And it just makes me wonder, which way is this going to resolve? Is this going to resolve to the downside, which would have to be negative for the market, or does it break upwards, and does this divergence disappear and we get a stronger overall market with broad participation? So, it’s yet to be seen how this resolves. But as it stands, I think this is the weak link in the overall market. And that weak link is the lack of participation. Just over 50%. It’s about 54% of stocks are currently above their 50-day moving average. So, it’s almost a 50-50 thing. It’s line ball. Half the stocks up, half the stocks below the moving averages. So, this is the part we really need to see resolved to give us a clearer indication on the strength of this rally or how sustainable this rally is.
And just going over and having a look at the Russell 2000, the small caps. And again, we’ve got this situation where the smaller end of the market is just not participating. You see the Russell sitting beneath these declining moving averages, the 50 and the 100-day moving averages. As I often say, a market is most vulnerable when it’s beneath moving averages. And the length of time spending here is a concern. The longer it’s beneath the moving averages, the higher the probability that this market actually breaks to the downside. That hasn’t happened at the moment. It’s still sitting above support, but we really need to see this turn and get back above the moving averages, so then we’re starting to talk about this as a basing formation. But at the moment, we’re below those averages, which is something which needs to change really to get a longer-lasting sustainable overall market rally.
So, it’s really a two-speed market at the moment. We’ve got stocks like Nvidia and Meta. They’re up 100% over the last 6 or so months. You’ve got Google breaking out, but then you got a section of the market, big section of the market which is not participating. So, I think the player remains the same. It’s a case of being…it’s really a case of being cautiously long. That’s been the play for months now. I think it remains the case. It’s not a time for big bets. And it’s time for caution and managing risk, looking at stocks on an individual basis even, looking for the stocks like Google where you do get those good setups.
But let’s leave it there for this week. Hopefully, that’s been interesting. Thank you for joining me. I look forward to coming back and talking to you next week. Till then, bye for now.
Please see video for more detailed analysis and charts
Looking for the best ASX stocks to buy now?
Motion Trader‘s algorithms scan more than 2,000 ASX stocks daily in search of medium term investment trends. We then tell our members precisely when to buy shares. And most importantly, we tell them when to sell.
Try a no obligation FREE 14-day trial of Motion Trader, and see what an algorithmic trading approach could do for you.
Meet Jason

I'm Jason McIntosh, the creator of Motion Trader. My career began in 1991 on the trading floor at Bankers Trust. Nowadays, I trade my own systems from home in Sydney.
Motion Trader is for investors who value robust analysis, data driven entry and exit signals, commentary, and education. I use engineered algorithms to identify when to buy and sell ASX stocks. No biases or guesswork, just data driven signals.