ASX 200 Builds Quietly | Episode 130
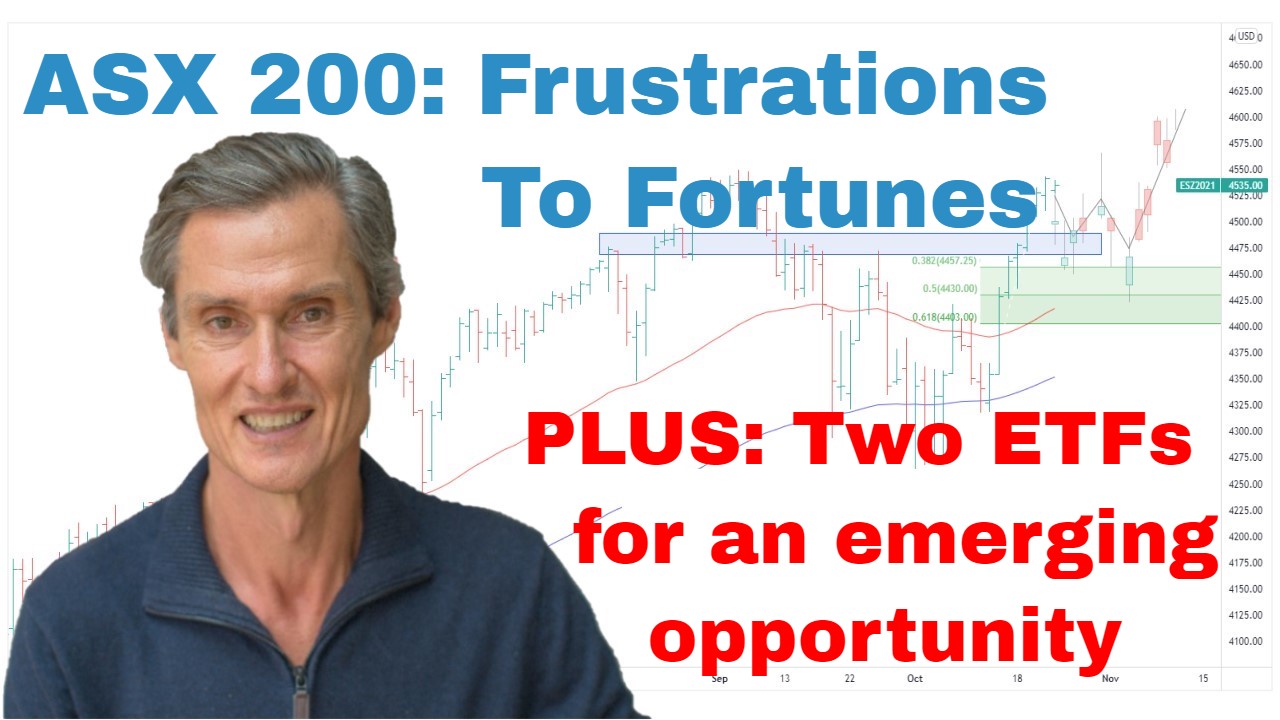
Where is the Stock Market Heading?
00:00 Intro
00:30 If the market is frustrating you, watch this
03:12 What the Small Ords did this week
03:40 This sector looks ready to run
05:14 An emerging opportunity (and 2 ETFs to play it)
08:24 This is my strategy for gold
10:20 Should you buy the dip in copper?
11:24 This is a key risk for commodities
12:33 Look at uranium’s latest set-up
Transcript
Please note: Charts available from video
This video is going to focus on the ASX 200. I’m also going to have a look at gold, copper, and uranium, so make sure you stick around for that. I’m going to cover the S&P 500 in a separate video. You can view that video here. As always, this is general commentary. It doesn’t take your personal situation into account. With all of that said, let’s get into our first chart.
So, we’ve got the ASX 200 up on the screen. And it’s really been a very quiet week. Not a whole lot to report. We’ve got a situation where the market really is quite… It’s really quite directionless at the moment when you look at this over say an 18-month timescale. We’ve got the market now. We’re bouncing off some Fibonacci support. So, this is a Fibonacci from the March low to the recent high I spoke about last week. We’re bouncing off that support where we’re just above some moving averages. So, I’ve got the 50 and 100-day moving averages. So, that’s all supportive. But as I was saying, we’re in the middle of this big range, and the ASX 200, it hasn’t made a new high for… We’re coming up to two years now. And I know a lot of people find this type of period really frustrating, and they find it frustrating because quite simply it’s a lot harder to make money when the market is trading like we’ve been seeing over this period.
We’ve got a situation where there are fewer trends. So, uptrends are fewer and further between. The trends often don’t last as long when they do occur, and we get more false breaks. And people find that awfully frustrating, and it is. But the thing is this is part of the cycle. What we’ve been experiencing is part of the stock market cycle. It happens. You pull up a 30-year chart. This stuff happens every… It may happen a couple of times every decade where you get these long pauses in trends. And these periods are all about minimizing your losses. They’re not, I repeat, they’re not about making a fortune. You’ll potentially make a fortune, or at least the foundations of a fortune, in the upward part of the cycle. That’s when you’re swimming with the tide. That’s when the good stuff happens. This stuff is about protecting your capital. It’s about staying in the game, so when the upward cycle comes back, you’re ready to go. Don’t expect magic to happen during the sideways portion of the market. It just doesn’t happen.
And I say that because I get emails from people saying, “I’m frustrated my stocks are losing money, or they’re not going anywhere.” This is why. It affects us all, and it’s just the way the markets work. So, stick to your process, be conservative, and hang in there because those big trends, they do ultimately return.
And just going over and having a look at the small ordinaries. And just like the ASX 200, not a lot’s happened in the last week. We’re above these moving averages, but there’s not a lot to be said. It’s going to take time before we know whether this is a large basing formation or something else. At the moment, it’s looking like a basing formation could be taking shape. But we just got to wait and see. And we don’t have much to go off of the last week.
What has been interesting, I have been having a bit of a look at this subsection of the ASX. It’s the ASX All Technology Index. What’s interesting here is that we have a market which is stepping higher. So, just using the low from January. We had an impulsive rally. We had the sideways corrective, this compression-type range where the price action got tighter and tighter then broke to the top side in an impulsive fashion. And then the last few weeks has just been this grind sideways just above…coming back to the moving averages. So, we’ve got the 50 and the 100-day moving averages. They’re both rising. It looks like a market. It looks like an indice, which is going to try and extend higher. Maybe that ties in with what we’re seeing in the NASDAQ. So, it does look like one of the more interesting sections of the ASX. It’s also one of the most beaten up. You look how far this indice fell.
So, maybe have a look at some of the stocks in the All Technology Index. Just Google up the All Technology constituents, and you get a list of stocks. Have a look there. There could be some interesting ideas.
I want to tell you about another area. I just want to jump away from the ASX. I want to tell you about another area, which I’ve been watching for a while waiting for something to happen. You could see something was in the makings but wasn’t quite ready. Now it looks like maybe it’s ready. It is the Nikkei, the Japanese Nikkei. And what we have here, so this… Let’s just enlarge this price action a bit. What we’ve had over much of 2022, we’ve had this trading range not dissimilar to many other markets being stuck within a trading range. What we’ve got at the moment is we’ve got a situation where the Nikkei is breaking out to the top side of a trading range. S&P 500 looks like it could be getting close to doing something similar, but is yet to do so. Nikkei is maybe it’s leading the way. It’s also broken above this resistance that it had at around the 28,000, 28,500 mark, which defined the upper end of the range. We’ve got the moving averages have crossed and have turned higher, now trending upwards, and we’ve got this breakout.
So, it’s also interesting to look at the Nikkei on a weekly basis. Just stepping back, taking a big-picture view of this. So, there’s that big all-time high from back in 1989. And what we’ve had really since 2009, so really over the last, what, 13, 14 years, we’ve had this… It’s like a series of steps. We’ll have a rally, we’ll have a consolidation, a big rally, consolidation, rally, consolidation, rally, consolidation. And so, maybe this is just the… We’ve now got a base. And every time we get those consolidations, we get a base. We get a new launching pad for another move higher.
Maybe this next base, if that’s what it’s going to be, is now in place, and the Nikkei is turning up, Japanese stocks are turning up. I think it’s just a matter of time before this all-time high is surpassed. There will be I think almost certainly a new all-time high in Japanese equities. It may still take several years. I don’t know the timing of these things, of course, but it looks like a nice setup. If you’re interested in Japanese stocks, you want to do something outside of Australia, maybe this is a section to consider some exposure.
A couple of ETFs that could help with that if you are interested there, and these are locally listed. HJPN, so that’s a Hedged Japanese Equity ETF. So, hedge means the currency exposure is hedged. If you’re happy with an unhedged currency exposure then it’s IJP. They’re a couple of which are worth considering if you’re interested in some Japanese exposure.
Now, I’m going to have a look at some commodities in a sec, but, first of all, if you’re getting some value, please hit that like button. Please leave a short comment, just “Hey, Jason. Thanks for the video,” and then YouTube does a thing, and shows more people. And hit the subscribe button if you haven’t done that. And visit me over at motiontrader.com.au, and see whether what I do with trend identification and strategy, and systematic process might be able to help with what you are doing with your portfolio.
Now, let’s get into some of these commodities. So, gold. Let’s start off with gold. Very interesting week in gold. Got very close to this big high point, this big resistance at 2080, and has had a swift pullback. Now, this is something we’ve been talking about for a few weeks now, the potential for gold to pull back, and up at current levels. It just doesn’t appear like an asymmetric entry point. That remains the case. Nothing has changed from that respect. I still think gold is vulnerable to consolidation following this. It’s about a 30% rally that gold has had since around November last year, so what’s that, six, seven months? Thirty percent, you got to expect at some point you’re going to get a consolidation there, particularly when such heavy overhead resistance is in such close proximity.
Also, you might remember last week, I was talking about the divergence, which is coming up on the RSI. And this is just something to be aware of. Divergence is a funny thing. Sometimes it’s useful. Other times it’s not. But I think this is quite notable divergence that we’re getting in gold where the RSI is declining despite the price making new highs. I think it’s just showing the market’s stretched. I think it needs to do some work. It needs to pull back, it needs to form another base, consolidate before then, potentially, pushing higher, and breaking to these new highs, which are so eagerly anticipated. But the timing might not just be there.
My strategy with this is to hold the stocks I have, not to be too clever by getting in and getting out. But in terms of adding, I’d rather add positions after some sort of a pullback and a consolidation. But let’s just see how this unfolds.
Copper. Interesting week in copper in that last week, and let me just get rid of that RSI, we had a breakdown in copper. You might remember last week I was talking about how it looked like. It was consolidating, it was generally okay, but there was a point of vulnerability because we were sitting beneath these moving averages, and didn’t think it was a time to be adding to positions. And this happens so many times. Markets below moving averages, they’re the vulnerable ones. And so, as it turns out, copper has had this spill to the downside.
I don’t have a strong view here of what’s going to happen, but I do know that I don’t want to buy this dip. I want to see how this starts to play out and then consider, does it stabilize? Does it start to turn higher? I don’t know. Let’s just see how this plays out. But yeah, another example why we’re cautious of markets, why we’re respectful of markets when they’re below moving averages. Not a time to step up, and take on a whole lot of risk, I don’t think.
And what I think we should be keeping an eye on also is the U.S. Dollar. And this could have an impact on gold and copper. U.S. Dollars had a big decline since September last year. And what seems to be happening, I’ve been watching this the last few weeks, in that it seems to be finding support. It hasn’t broken higher. It is still in the downtrend. It’s still below moving averages, so I certainly don’t want to be trying to predict a low or buy a low. But I’m wondering, if the U.S. Dollar were to have some sort of a bounce off this support that it seems to be forming, maybe that’s another catalyst for gold and perhaps copper to pull back further, to consolidate further. Let’s just watch this space and see how it starts to unfold. Maybe the dollar has another fall. Maybe it turns and goes lower, but just be aware it’s sitting on support. When markets are on support, they can bounce. Doesn’t mean a complete turning point, but it can mean a period of adjustment and upward correction.
Lastly, just going to finish quickly up on uranium. Yeah, it’s been a positive week. We’ve seen some more strength coming in. These moving averages look like they’re about to turn higher again. So, it gets us up on the upper end of the range. But nonetheless, uranium is still in a big range. So, really nothing particular to rush out to do. I don’t think. What is interesting… I’m going to take these lines off because that was marking up a range that we were looking at previously. And what you can also see here, you can also see there’s a range within a range. So, let’s just quickly put on some trend lines. That’s our upper range, and then we have the lower trend line.
So, we’ve got this coiling pattern, which is taking shape. And this is really interesting. It’s going to be really interesting to see what happens here. May not be ready to go yet, but it’s a thing where you could see this thing develop. That could develop out of this range. It might not. It might turn to the downside. We’ve just got to wait and see. But this is a price action which I’d love to see in uranium to give the green light to get some more exposure and to see some of the positions I have currently go on another run. But let’s wait and see. It’s a nice clearly defined range. It’s a really interesting one. So, we’ll keep an eye on that over the weeks ahead.
So, let’s leave it there for this week. Thank you for joining me. Hopefully, that’s been interesting. Hopefully, you got something from that. And yeah, I look forward to talking to you again next week. Till then, bye for now.
Please see video for more detailed analysis and charts
Looking for the best ASX stocks to buy now?
Motion Trader‘s algorithms scan more than 2,000 ASX stocks daily in search of medium term investment trends. We then tell our members precisely when to buy shares. And most importantly, we tell them when to sell.
Try a no obligation FREE 14-day trial of Motion Trader, and see what an algorithmic trading approach could do for you.
Meet Jason

I'm Jason McIntosh, the creator of Motion Trader. My career began in 1991 on the trading floor at Bankers Trust. Nowadays, I trade my own systems from home in Sydney.
Motion Trader is for investors who value robust analysis, data driven entry and exit signals, commentary, and education. I use engineered algorithms to identify when to buy and sell ASX stocks. No biases or guesswork, just data driven signals.