ASX 200 At Key Pivot Point | Episode 134
Where is the Stock Market Heading?
00:00 Intro
00:30 ASX 200 losses it’s footing (should you worry?)
04:20 This is what I’m doing in the Small Ords
05:12 Here’s an example from my portfolio
06:02 Check out this emerging opportunity (be ready if it goes)
08:07 Is gold ready to rebound?
11:25 Copper pulls back (should you buy this dip?)
12:00 Why you should watch iron ore
Transcript
Please note: Charts available from video
This video is going to focus on the ASX 200. I’m also going to have a look at gold and copper. And I’m also going to show you another market, which is really shaping up the view, looking quite interesting, so make sure you stick around for that. I’m going to cover the S&P 500 in a separate video. You can view the SP500 video here. As always, this is general commentary. It doesn’t take your personal situation into account. With all of that said, let’s jump over to our first chart.
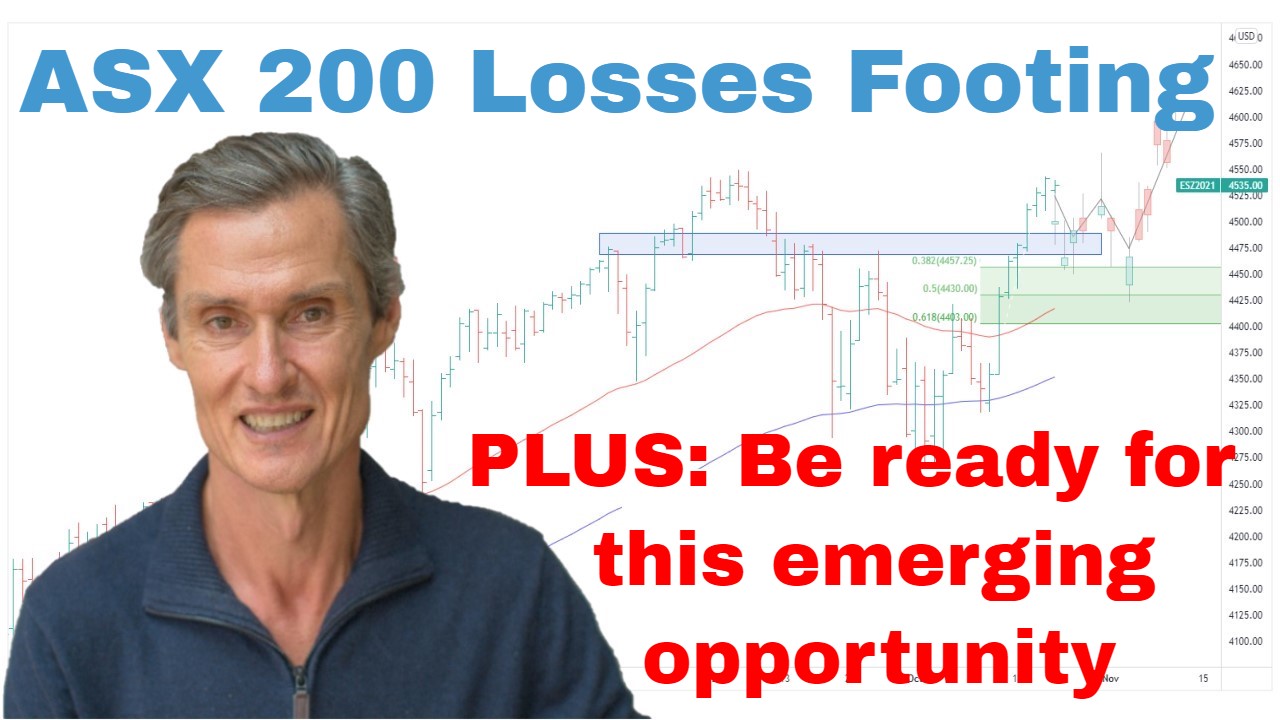
So, ASX 200. It’s a interesting week. Actually, lost a little bit of footing during the week, lost its footing above the moving averages, and we’ve seen it decline down to an eight-week low, in that eight-week low on Thursday. And it’s also broken out of this little consolidation, little compression pattern. So, I’ll just draw some lines on to highlight that pattern. And it’s, yeah, coiled up for a few weeks, and it’s now just broken to the downside.
One of the things we can do, an interesting thing to do as always, is to put these Fibonacci retracements on. So, I’ll use that low we had from March, and I’ll use the recent high. And it’s interesting when you do that because so far this pullback is quite well proportioned to the previous rally. So, I’d still say that this pullback is comfortably within the parameters for a consolidation following the rally off the March low. But I think the fact remains that we can’t lose sight of is that this is still part of a big sideways consolidation.
And, in fact, if you look at where the ASX 200 is now, it’s at the same level it was this time last year. So, two years of jumping around on the spot, and actually not going anywhere. So, they’re pretty difficult conditions when you go through a market like that. And I think the big thing to… I know this is a frustrating period for a lot of people, and the big thing you always got to remember is that this is the difficult part of the cycle. It’s nothing new. This process has been playing out for centuries where we get good trending periods, and then we get the sideways grind or the downward period. It’s a counterbalance to every upward phase in the market.
And I know it’s hard to imagine these boom times returning. It always is during the two years of unpleasantness, but you know what? The good times do eventually come back. They always have in the past. I see no reason why this period we’re going through is going to be any different. It’s all about you need to manage your risk during the difficult part of the cycle, and don’t have high expectations on making 10% every year because it’s not going to happen during this part of the cycle. And then just be patient. Be patient for the right setups to come. They will come. It’s a matter of riding through this period protecting your capital.
Just coming back to our recent price action. We’ve got a series of lower lows just over the last few months. And we really need to see this sequence broken. I wouldn’t say that this is necessarily a bearish sign, but we do ultimately need to see the lower lows broken, and new highs returning to get the conditions for an upward potential, upward trend to be able to take hold.
I think as I just keep saying, I sound like a broken record when I say it, but it’s just a time for ongoing caution. And you look at the extra risk level, which seems to be appearing in the U.S. market, and it just adds to that overall positioning to I think of caution within a portfolio.
Now, just going and having a quick look at the small ordinaries during the week. It’s also given up some ground. So, last week, I was saying it was just trading sideways and holding nicely above these moving averages. We’re now fine. We’re on the other side of the moving averages where we’re smack in the middle of the range. I’m going to say, I’m just not in a hurry to do much at all with a market when it’s like this where it really is directionless. You can’t get more directionless than being in the middle of a range.
And I continue to exit stocks in my portfolio that are weakening, and that are hitting my exit levels, but I’m also still buying some stocks. I’m buying stocks, which are showing some strength. There’s fewer of those, of course, but there are still stocks, which are doing well in this market, which is just meandering sideways.
And I’ll give you an example. This is one of the best stocks in my portfolio at the moment, a stock called Duratec. It was certainly the best stock in the last week. Just in the last week, it’s put on 13%. It was up close to 20% at one point. And you can see these upward trends. They do still exist. In a market where we’re in at the moment, they are fewer and further between. And the distance they run is often less than they may run in a big bullish period, but you can see the moving averages cross. You get the signs of upward momentum, you get a breakout higher, and they’re the conditions of an upward trend, and then it’s a case of letting profits run. So, this is a stock I’m interested in in the current environment. There’s just less of them.
I’ll show you one area, which I am keeping an eye on, which is shaping up as a potential opportunity. It’s emerging Asia. And this is an ETF. This is the Vanguard Asia ETF. VAE is the code. It’s an ex-Japan, so India, China, a lot of those emerging markets, as well as developed markets like Singapore, but it’s mostly the emerging ones. This is interesting. It’s really had a big downward period over ’21 and 2022. But you just look at the price action since around October, November last year, started to get that upward momentum coming back. The moving averages, the 50 and 100-day moving averages have crossed. They’re starting to trend higher.
This market has now… It’s been treading sideways for the last…well, since January. So, what’s that about? About four months now of sideways. It’s coiling. It’s a compression zone. We don’t have a breakout yet, so it’s just… So, at the moment, for me, it’s a point of interest. But I think this would become interesting if we saw prices break above these previous highs. Not there yet. So, it’s on the radar. It’s one of those ones to keep an eye on at one of those areas.
We looked at the Nikkei recently. Quite dull trading can lead to some quite interesting and powerful trends when you get the breakouts. You just got to be patient. Got to wait for them. Maybe it doesn’t happen. We’ve just got to wait and see. Another ETF in this area is IAA. So, I think it’s an iShares Asian ETF. So, check them out if you’re interested in that thing.
Now, if you’re getting some value from this, please hit that like button. Please leave a short comment, just “Hey, thanks for the video.” It tells YouTube you’re watching, it tells YouTube you’re engaging, and YouTube does what it does, and shows other people. It helps me a lot. Please do that. Also, hit that subscribe button. And come over and check out what I do at motiontrader.com.au.
Now, let’s wrap up with a couple of commodities. Gold, as we touch on most weeks. Yeah, look that pullback we’ve been speaking about since somewhere in mid-March. It’s gathered more steam through the week. It’s back to the 100-day moving average now. So, this would be a natural point to get some sort of a bounce.
Also interesting, let’s just put on a Fibonacci retracement from this leg of the rally. And yeah, we’re right in that 50% retracement coming in at the 100-day moving average. It’d be a classic place to get at least some reaction upwards. I don’t think it’s a tradable bounce. It’s not a dip I want to buy at the moment. My feeling with gold is that it’s going to take some more time to just work below this big overhead resistance at around 2080. I think it might take some time before we can potentially get a break above there. But let’s just watch this price action, and see how it develops through the week.
And the other thing I think, which is notable with gold, and I looked at this last week, it’s Newmont, the world’s biggest gold stock about to take out Newcrest Mining. And it’s just interesting. So, just think to yourself, say you didn’t know where Newmont was trading, and I say to you, “Okay, gold is trading just within a whisker of an all-time high.” What would you think of Newmont, the world’s biggest producer? Well, you probably wouldn’t think that it was wallowing down at historically low levels. But that’s where it is. So, I think, to me, what that says is there just doesn’t seem to be any institutional interest in the gold stocks at the moment. So, I think, for me, that’s a sign that the excitement in gold stocks is just temporarily over.
It hit a new six-month low during the week, lowest level in six months. We’ve got declining moving averages. It could well form a base down around these current levels, but I think that would potentially take several months to trace out some sort of a basing pattern, and then start to round higher. I don’t think it’s something that’s going to happen in the next couple of weeks. Of course, anything can happen. I could be completely wrong, but it’s just I think the balance of probability favors that the excitement in gold is just on hold, it’s on hold for now.
And another reason for that is this U.S. Dollar Index. Looking at the dollar index through the week. It’s continued to strengthen. We’re now above these moving averages. The moving averages look to be rounding higher. We’ve got to see what happens to the dollar over the months ahead. But just as a near-term proposition…
Let me just put some Fibonaccis of this decline on. And when you do that, even just a typical Fibonacci rebound could see the dollar strengthen a bit more over the next month or two, or whatever it may be, and that would be… It would be something, which could potentially suppress the gold price and commodities generally. So, I think we’ve lost that tailwind of the declining dollar at least for the time being.
And the same goes for copper. It’s also weakened through the week. Moving average is now clearly in decline. Price is below. We’re getting a little bit stretched below them. Maybe there’s some sort of a rebound. Maybe that fits with what I was saying with gold at around that 100-day moving average. Maybe there is a rebound, but it’s not a dip that I currently want to buy. I’d want to see some more stability start to develop, some more upward momentum. I think we’ve got time to think about what we want to do with copper. Let’s watch this space.
And just lastly, one quick commodity we don’t usually look at, this iron ore. Just having a look at the iron ore price. And this is important for the Australian stock market generally because it influences BHP, Rio, and Fortescue. And you put those three together, and it’s a big chunk of the ASX 200. I’m not sure off the top of my head, it could be north of 15% of the ASX 200.
Below these moving averages, 50 and 100-day moving averages were in decline, price is below there. Should iron ore continue to come off over the next few months…maybe that’s another reason for the ASX 200 to be stuck within this range. So, it really is I think very much a stock-specific market, but don’t be looking for too much excitement until we start to see prices breaking high, until we see key commodities start to stabilize and start turning up.
So, let’s leave it there for this week. Hopefully, that’s been interesting. Hopefully, that helps. And I look forward to coming back and talk to you next week. Till then, bye for now.
Please see video for more detailed analysis and charts
Looking for the best ASX stocks to buy now?
Motion Trader‘s algorithms scan more than 2,000 ASX stocks daily in search of medium term investment trends. We then tell our members precisely when to buy shares. And most importantly, we tell them when to sell.
Try a no obligation FREE 14-day trial of Motion Trader, and see what an algorithmic trading approach could do for you.
Meet Jason

I'm Jason McIntosh, the creator of Motion Trader. My career began in 1991 on the trading floor at Bankers Trust. Nowadays, I trade my own systems from home in Sydney.
Motion Trader is for investors who value robust analysis, data driven entry and exit signals, commentary, and education. I use engineered algorithms to identify when to buy and sell ASX stocks. No biases or guesswork, just data driven signals.