A Guide to Share Analysis: Which is the Best Share Analysis Strategy for Investors?

By Jason McIntosh | Updated 7 June 2023
Investors always want to know the best share analysis strategies. The right guide to share analysis can give you a big headstart and help you decide which companies to buy.
Do you choose the company with the highest demand, or the lowest debt?
Or do you look at share price charts and technical indicators?
If you’re tossing up between two companies, how do you know which one is the better investment?
That’s where share analysis comes in. Investors use share analysis strategies to find opportunities, research stocks and predict what might happen to them in the future. It’s also how many professionals analyse a stock before investing.
There are three main schools of thought: fundamental, technical, and quantitative analysis. They all have their benefits, which is why many successful investors use a blend of these approaches.
In this article, we’ll break it down so you can learn how to buy and sell shares.
What is fundamental analysis?
A fundamental analysis of shares takes a deep dive into a company’s financials to figure out the value of its stock.
It involves looking at these key areas:
Earnings per share (EPS)
When shareholders buy a stock, they’re basically buying into the company’s future stream of earnings. EPS refers to the return on investment, and it determines how profitable one of the company’s shares is. In an analyst’s world, this is called “profitability per unit of shareholder ownership.”
They then use this metric to assess whether a company could make money in the future, and if it’s worth buying. For that reason, EPS is one of the best ways to evaluate a share’s intrinsic value.
Price-to-earnings (P/E) ratio
P/E takes it one step further. It looks at a company’s recent EPS against the market price of a share to give you an idea of what you’ll pay to buy into a company’s future earnings.
You’ll typically see the P/E with a number that’s a multiple of the company’s earnings. This valuation multiple is a useful metric when you’re comparing competitors in the same industry.
Here’s why: the lower a company’s P/E, the cheaper their shares — which potentially makes them more valuable to investors. For example, if Woolworths had a P/E of 30 and Coles had a P/E of 15, Coles may be considered better value.
To calculate the P/E ratio, search for the company’s latest EPS figures on their website. They’re usually in the corporate or investor section. Then, divide the current share price by the EPS to find the P/E.
As you learn share trading and form your own solid investing strategies, it’s a good idea to keep an eye on the P/E ratio. If it increases dramatically, that could be a sign that the share is overvalued. Sometimes, investors get caught up in the hype around a company and push the demand and share price up, only to overestimate the company’s earnings.
Expenses, assets and liabilities
Next up, assess how much money is going in and out of the company. You can do this by looking at their balance sheet. This financial statement breaks down the company’s cash in comparison to its debt, and lists its other assets.
Here are the line items to pay attention to:
- Book value per share: Search for the company’s net worth in the balance sheet, then divide it by the total number of outstanding shares. That’s the “book value per share.” Compare this number to the current share price to find out if you’re paying a premium for your shares, or scoring them at a discount.
- Cash and cash equivalents per share: This ratio will reveal the liquidity of the company. To find the figure, divide the total amount of cash and cash equivalents by the number of outstanding shares. If a company has a lot of cash compared to its competitors, it’s probably financially sound.
- Debt-to-equity ratio: Divide the company’s total debt by its net worth to get its debt-to-equity ratio. This number will tell you whether a company is struggling to meet its financial obligations.
- Free cash flow: Finally, this figure outlines how much money a company has after paying its expenses. The higher the free cash flow, the higher the company’s financial stability.
You could also look at a company’s quarterly revenue compared to previous quarters. The goal is to invest in companies with consistent growth.
What is technical analysis?
While fundamental analysis assesses a stock’s value based on financial results, like earnings and company profits, technical analysis focuses on a companies’ share price history. Built on Charles Dow’s work, it’s based on the idea the market tends to follow patterns.
Three of the key principles are:
- Share prices reflects all public information about the stock. Technical analysts look at price movements, because they believe the share price contains all the information they need to know. They believe it holds up a mirror to all fundamental factors as well as market sentiment.
- No price changes are unique. Analysts believe all price movements can be traced to a past or current trend. They don’t subscribe to the idea that stock prices move erratically. Rather, they follow three phases: Up, down, and sideways. The aim is to identify which part of the cycle a stock is in, and then profit from that knowledge.
- History often repeats itself. Technical analysts attribute the repetitive nature of price movements to market psychology. They pay close attention to the rollercoaster of emotions investors go through, from excitement to anxiety, and try to identify trends.
So, technical analysts use historical stock charts to assess:
- Price trends and patterns
- Past performance of stocks
- Volume and momentum indicators
- Oscillators
- Moving averages
- Support and resistance levels
Here’s an example:
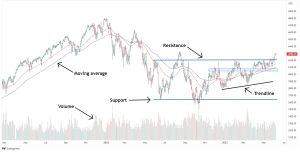
This is a chart of the SP500. It shows how technical analysis can be used to identify market tends and patterns. Technical analysis is one of the most widely forms of share analysis.
The findings can then be used to generate entry and exit signals, as well as drill down on a stock’s strength or weakness compared to other stocks in the market.
Technical analysts use share price data to help identify trading and investment opportunities.
What is quantitative analysis?
As you might have guessed, quantitative data analysis is all about maths and is integral in forming the basis of your share analysis. This approach relies on mathematical and statistical analysis to determine whether to buy or sell a share, and it’s what Motion Trader specialises in.
While quantitative risk analysis has been around since the 1970s, it really took off during the dot-com boom in the 1990s, when computers became more mainstream and could crunch huge amounts of data in the blink of an eye.
Quantitative trading analysts are known as “quants,” and we collect a variety of data to develop trading algorithms and computer models.
Some of the key data we analyse includes: price, volume, volatility, and company size. The aim is to identify patterns and trends across potentially thousands of stocks. An advantage of this type of analysis is that it can cover much more ground than a human, and in a tiny fraction of the time.
Quants then use those findings to develop a trading strategy. These metrics can help investors analyse investment opportunities and make more profitable decisions. They also allow investors to identify shares that match their risk tolerance and help mitigate their overall risk.
Watch this short video to see a real-life algorithmic portfolio:
This type of share analysis removes much of the human bias, emotion, and subjectivity from the process, ultimately providing you with a way forward in regards to understanding solid investing strategies. The algorithms are consistent, which is why many of the best investors rely on them to make sound investments and give them an edge in the market.
Strengthen your trading strategy
All of the approaches to share analysis could help with your decision-making when it comes to ASX investment strategies, and you don’t have to choose just one! Investors often use technical and quantitative analysis to identify opportunities, and then use fundamental analysis to zero in on the stocks that best suit them.
If you want to teach yourself about shares, technical investing strategies or algorithmic trading, check out the rest of our website or register for our free video training today!

Jason McIntosh | Founder, Motion Trader
Jason’s professional trading career began over 3 decades ago. He’s a founder of two stock advisory firms, a listed funds management business, and has helped thousands of investors navigate the stock market. Click here to read Jason’s incredible story of, at age 20, sitting alongside some of the world’s greatest traders (and the life changing experience that came with that).
Meet Jason

I'm Jason McIntosh, the creator of Motion Trader. My career began in 1991 on the trading floor at Bankers Trust. Nowadays, I trade my own systems from home in Sydney.
Motion Trader is for investors who value robust analysis, data driven entry and exit signals, commentary, and education. I use engineered algorithms to identify when to buy and sell ASX stocks. No biases or guesswork, just data driven signals.