Worst Scenario For SP500 Bears | Episode 137
Where is the Stock Market Heading?
00:00 Intro
00:34 Will the SP500 burst higher?
02:35 This strategy has been a disaster
04:48 Simply extraordinary. We rarely see this.
08:02 These stats are fascinating
09:39 This could be the best case for the Nasdaq
11:14 Why I’m watching this Nasdaq stock (it’s looking good)
Transcript
Please note: Charts available from video
This video is going to focus on the S&P 500. I’m going to cover the ASX 200, as well as gold and uranium in a separate video. You can view that video here. And I’ve also got some fascinating stats for you. I think you’re going to want to see them. And as well as that, I’ve got a stock which I think you might want to keep an eye on, so make sure you stick around for that. As always, this is general commentary and doesn’t take your personal situation into account. With all of that said, let’s get into our first chart.
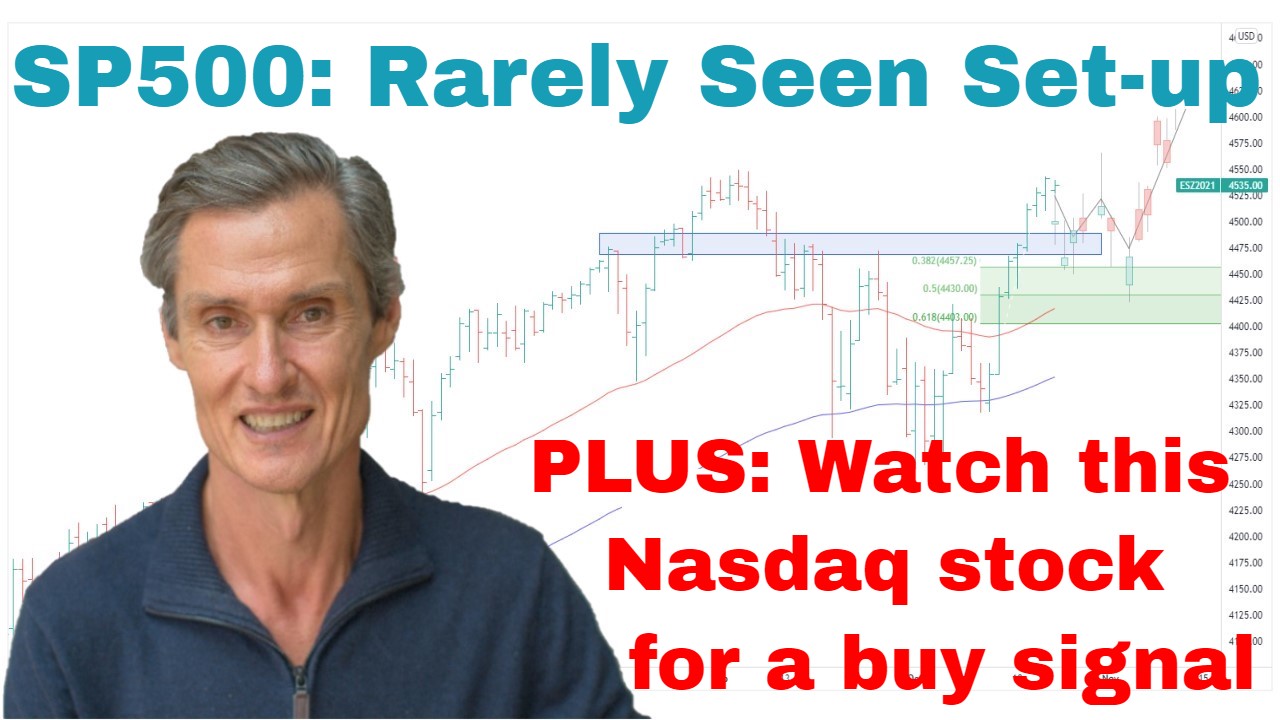
So, I’ve got the S&P 500 up on the screen. And this really is an extraordinary situation. I’ll explain why in a moment that I think it’s an extraordinary situation. But first of all, we’ve got this setup now where the S&P 500 is really testing the top of this range that has been in for the last…coming up close to a year now. And just in the last couple of weeks, there have been a couple of times where the bears have tried to sell this market down and get some downward momentum happening. And both times, there’s been buy the dip and the market’s sprung back up. And the latest rally that we’ve been seeing, just over the last couple of weeks, it’s coming off the 50-day moving average, which is a typical place where you’d see buy-the-dip activity in a market with upward momentum.
And I think what’s also interesting to do, let’s step back and have a look at this from a four-hourly perspective. Just gives a little bit more detail on the price action that we’re seeing. Now, what I want to focus on here is, even if we go back to April, you see each sell-off that we’ve had has been followed by a powerful snap-back rally. And this has happened several times over the last probably month and a half. And just the most recent, just last week, we had the fall early into the middle of this week, then we had a snap-back rally. And then on the Thursday session, we had another fall and a powerful snap-back rally near the close of the session. So, to me, that suggests that the S&P 500 is being underpinned by some pretty strong buying interest.
So, just coming back to the daily chart, and I think what’s been so interesting, we could say over the last couple of months but really could say the last six months, is that people do not want to believe this rally. They don’t want to believe it’s possible, and they continue to want to believe it’s a bear market rally. And maybe it will automatically fail. We don’t know. No one knows how this is going to play out for sure. And this rally could fail and the market could fall to new lows. But we don’t know. We just don’t know how that’s going to go. At the moment, we have this momentum to the upside.
And I think that people who are fighting this momentum by arguing and shorting the market and insisting that it has to go down, I think that’s a mistake. If you don’t want to play and you want to sit on the sidelines, that’s one thing, but I think standing in the way of it and actively shorting the market I think is a dangerous strategy.
So, just for instance, have a look at this. So, this is the ProShares Ultra Short NASDAQ, so the SQQQ. And so anyone just taking a position just over the last month, so saying, “Market is at the top of the range, now’s the time to go short,” anyone who did this with the SQQQ, they’re down about 30% in 4 weeks. So, this is why I say fighting momentum is a dangerous strategy. If you don’t want to play, don’t play. Don’t fight the momentum. It really is a hazard to your capital.
And now just coming back to the S&P 500 and just on that bit about people shorting the market, if this market does happen to conventionally break above this 4,200 level, it is quite possible that it does have a fast and strong move up towards 4,400 and beyond. So, this is why I say be very careful if you want to insist on being bearish. Maybe that will prove to be the case in months to come, but maybe it won’t. As I was saying, I think it’s a hazardous strategy.
So, why is this extraordinary? Why is this current setup extraordinary?
Well, let’s go to the equal-weight S&P 500. So, this is S&P 500 Equal Weight ETF. It is a very different setup to what we’re getting in the S&P 500 index. Look at the price here. It’s in the lower half of this trading range. While we have the S&P 500 trading, actually it’s starting to nudge out of the top of this range, the equal-weight is in the lower half of its range. So, that’s something which you rarely see for the S&P 500.
And just to demonstrate this further, have a look at this. So, this is the equal-weighted index or the equal-weighted ETF on the lower portion of the chart, upper portion of the S&P 500. And even if we look at it, say, from…let’s use these highs in February, you can see that the S&P 500 has been rising. It’s generally got this series of higher highs. Now look at what we have in the equal-weight, and very clearly, it’s a completely different picture. We have falling highs. And if we just take it from April, so just over the last month or so, we had these series of higher highs, higher lows. Look at the equal-weight, lower lows, lower highs.
So, there’s a real stark divergence in what we’re seeing. And historically, this type of price action is a warning signal because healthy bull markets are really based on broad-based buying, broad-based participation. And the current rally is really narrow. It’s really limited to… Essentially 7 of the S&P 500 stocks are producing basically all of the gains and the other 493 are not doing very much. So, we’ve got this weight of money coming in. It’s flowing into a handful of stocks. That’s not how these big bull markets would typically work.
So, having said that, I’m not saying that this is a time to preempt a turn, but I think because there’s always a possibility that there’s something going on in these markets that we don’t currently understand. So that’s why I say you can’t stand in the way of momentum. You can’t fight momentum. But as I keep saying, I think there’s enough evidence for us to say, “This is a time to be cautious. It’s a time to be cautiously long, cautiously going with this momentum, but being very acutely aware of the risk that this is a very narrow rally as things currently stand.”
So, I’ve got some fascinating stats. I want to show you these stats, which I think are really interesting. But first of all, if you’re getting some value from this, please hit that like button. Please leave a short comment, just “Hey, thanks for the video.” It just lets YouTube know you’re watching, you’re engaging, and then YouTube shows other people. And that helps me a lot. And also hit that subscribe button if you haven’t already done so.
So, okay, over to some interesting stats. So, this is from a website called Barchart, barchart.com, and this is a summary of stocks with new highs and new lows. So, I often like to show graphs. I think graphs are my favorite way of demonstrating something, but sometimes just some numbers also tell a great story. And so this is looking at various indices.
We’ll look at this one first, overall. And let’s start by looking at 52-week highs, 52-week lows. At the moment, we have a situation where over the last week, 74 stocks have hit a 52-week high and 188 have hit a new 52-week low. So, there are more than twice as many stocks hitting new lows than there are new highs. And you can go through all the time periods, whether it be six-month, three-month, one-month, two years, and you get the same pattern. So, maybe just pause the video and go through this for yourself.
And then just looking at the NASDAQ, because the NASDAQ is the big driver of really all the gains at the moment. And look at the NASDAQ. So, just coming down this level here. Let’s go to 52-week highs and lows again, and it’s 49 highs versus 107 lows. So, more than double the stocks are hitting 52-week lows, which is an extraordinary setup for a market.
Now, let’s jump to the NASDAQ for a market which is trading at a 14-month high. So, as I say, we don’t want to fight momentum, but we need to be aware of the potential weak spots in this rally and the potential dangers and how we should be positioning our portfolio with all of that in mind. I think, at the moment, this NASDAQ rally is getting quite extended above the moving averages. So, we’ve got the 50 and the 100-day moving averages here. This is an extended rally now. And I think the best thing the NASDAQ could currently do would be to probably pause and let these moving averages catch up, maybe some sort of a short-term consolidation, and then that could then, from there, move on to new highs. That would be the nicest-looking price action if we saw something like that.
I think what we don’t want to see now would be some sort of a spike higher from where we are. The NASDAQ quickly put on a few hundred points. We saw something like that because then that brings in the parabolic look to this price action. When you get parabolic price action, you increase the risk that you then get a swift and sharp reaction lower. So, I don’t know which way that’s going to play out, but they’re just a couple of things to look for. Do we get some consolidation in a rally, or is it going to be parabolic-like, in which case the warning signs really start to flash red?
Now, I’m going to wrap up in a moment. I’m just going to show you a stock, came up in my scans recently. Interesting stock. It’s not a big-name stock, Global-E Online, ticker code GLBE. NASDAQ stock. Market cap of about $5 billion. What they do is it’s an international e-commerce platform. And this is the setup which I like to look for. So, we’ve got a stock which has had a big decline, very much down and out. Period of base building has gone on. And just over the last three, four months, the moving averages have crossed, so the 50 and the 100-day moving averages. So, the moving average is now trending higher.
And we’ve got a stock which has been…just recently, it’s just broken out of this little compression zone, which we can draw in. So, this is a nice-looking pattern when you see a congestion zone, or we could also call it a compression zone where the price action starts to coil and then breaks out. And it’s interesting when you look at the volume. So, look at the volume on the breakout. There’s been a real increase in the activity in this stock. As the stocks then pull back towards the breakout point, we’ve seen the volume contract. And just in the last couple of days, the volume has increased again. So, this is a stock which I’m looking with interest.
These rallies have occurred off the moving averages. So, is this a stock which has got a base? And is it about to continue to move upwards? The way I would play this, I’d like to just watch it here and see, does it consolidate and then break to a new high? So, a break above this high from earlier in the week and a couple of weeks ago, for me, that would probably be a trigger to consider.
And so this is what I call an asymmetric risk-reward. So, the risk can be relatively small, and the upside is quite viable. I’d say that it’s got 3 to 1 risk-reward potential. So, that’s the opportunity I want to look at for in this type of market. This is by no means a sure bet. Plenty of these setups fail, but if you play risk-reward like this every day you trade, over time, you give yourself I think the best possibility to doing well from these markets.
So, just to sum it all up from here, I don’t think we have cause to be bearish on this market. I think there are warning signs. I think there are flags, there are reasons to be cautious. But let’s continue to see how this price action plays out. Let’s stick with the momentum while it’s there. I think that’s the play, but keep leverage down, keep risk low, keep extra cash, and be conservative. I think that’s the play of the day.
So, thanks for joining me. I look forward to coming back and talking to you next week. Till then, bye for now.
Please see video for more detailed analysis and charts
Looking for the best ASX stocks to buy now?
Motion Trader‘s algorithms scan more than 2,000 ASX stocks daily in search of medium term investment trends. We then tell our members precisely when to buy shares. And most importantly, we tell them when to sell.
Try a no obligation FREE 14-day trial of Motion Trader, and see what an algorithmic trading approach could do for you.
Meet Jason

I'm Jason McIntosh, the creator of Motion Trader. My career began in 1991 on the trading floor at Bankers Trust. Nowadays, I trade my own systems from home in Sydney.
Motion Trader is for investors who value robust analysis, data driven entry and exit signals, commentary, and education. I use engineered algorithms to identify when to buy and sell ASX stocks. No biases or guesswork, just data driven signals.