Trade the Trend | Episode 38
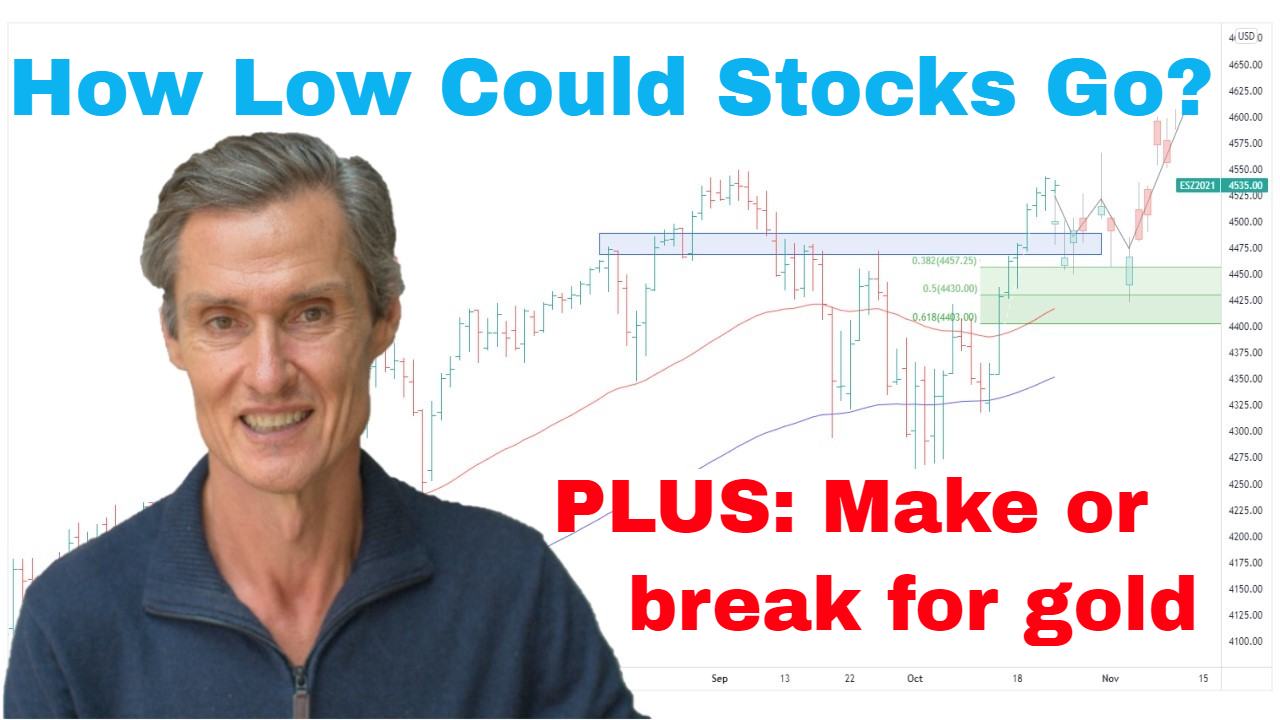
By Jason McIntosh | Published 30 April 2022
Trade the Trend is a weekly video focusing on where the stock market is going. It’s for investors and traders looking for insights to the market’s next move. Jason uses technical analysis of stocks and trend following techniques to help you piece together the world’s biggest puzzle.
Where is the Stock Market Going?
00:00 Intro
00:21 Is the S&P 500’s correction nearly over?
06:36 Must see chart… this is a huge change
08:09 How vulnerable is the Nasdaq?
09:46 These 3 stocks hold the key (and one just broke down!)
12:40 This sector has been devastated (Don’t buy the dip!)
15:13 This group of stocks are a barometer for the US economy
18:28 What does this “triple top” mean for the ASX 200
20:00 Look what just happen in my own portfolio
23:36 Should you buy the dip in gold and gold stocks?
Looking for the best ASX stocks to buy now?
Motion Trader‘s algorithms scan more than 2,000 ASX stocks daily in search of medium term investment trends. We then tell our members precisely when to buy shares. And most importantly, we tell them when to sell.
Try a no obligation FREE 14-day trial of Motion Trader, and see what an algorithmic trading approach could do for you.
Transcript
Please note: Charts available from video
Welcome to this week’s edition of “Trade the Trend,” a weekly video discussing where the stock market is going. I’m Jason McIntosh. It is Saturday, the 30th of April, 2022. As always, this is a general commentary and doesn’t take your personal situation into account.
All right. With that said, let’s jump over to our first chart: the S&P 500.
What a week we’ve been having. Over the last seven trading days, we’ve seen an 8% range in the S&P 500 and a 10% range in the NASDAQ. There’s really been a lot’s been going on.
Last week, I thought that maybe we were going to see a bit more upside, a bit more follow-through from the rally we had about four weeks ago. I thought we may have had one more test up towards 4,600 to 4,800 before potentially testing lower in maybe May or June. But the market just cut right through support around 4,350 and headed lower.
Let’s jump over to the hourly chart because hourly is good for just getting a little bit more definition of the price action through the day. So last week, the market was sitting on support around 4,350 as well as being in a Fibonacci retracement zone. If a market is going to bounce, that’s where it would typically bounce.
Of course, there’s no guarantee that that’s going to happen, but when you’re playing odds… you’re playing probabilities, that’s your base case. But that didn’t happen on this occasion. Instead, the price action broke through support and changed the game.
Some people were quick to point out that I was wrong and that we didn’t get a bounce. And you see it in the YouTube comments. But that’s okay because these videos aren’t about calling every move or having a crystal ball. It’s all about identifying the possibilities and then having the strategies to manage them.
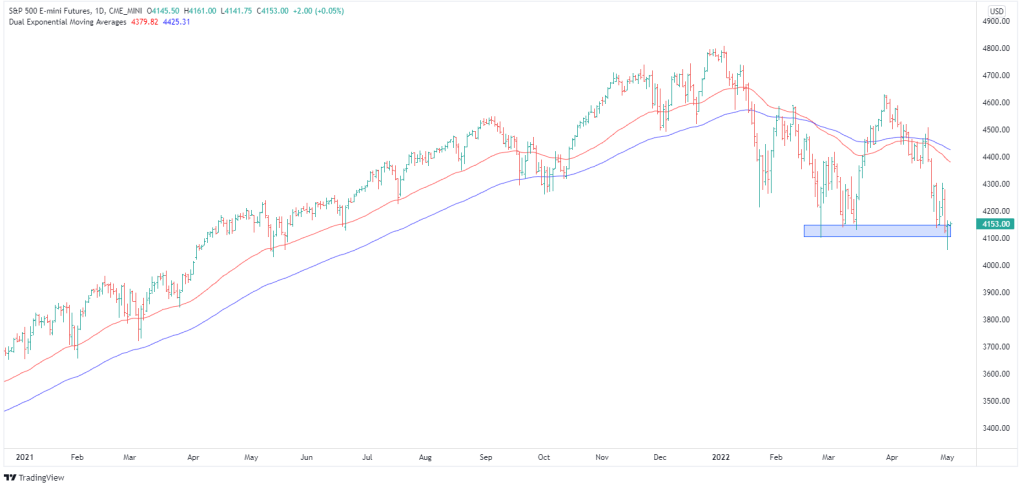
Let’s quickly just duck back to the daily chart. It’s important to keep everything in context. If you’ve been watching these videos for a while, you’ll know that we’ve been talking about my base case that I think we’re correcting the whole move from the COVID lows to the high. And I’ve been saying I think it’s going to take time and we’re looking for a big consolidation or corrective range, something within this box. And we’ve been talking about the possibility of this being the long-awaited 20% correction in the S&P 500.
I think it’s possible that we’re going to see the S&P 500 get this 20% correction at some time over the months ahead. And so we should expect that the price action within this band is going to be inconsistent and frustrating. A lot of people are going to find this period which we’re currently in difficult because the market just doesn’t have that consistency to it.
Think of it like this. It’s a bit like trying to navigate a boat up a shallow river which is full of rocky outcrops. It’s really hard to do, and that’s what corrective periods are all about. They lack the consistency of a trending market.
While these corrective periods are difficult, it’s also important to remember that they are a completely normal part of the cycle. And the aim of all this is to come out the other side with most of your capital intact. And that’s what I’m here to help with. That’s what these videos are designed for. The US market is currently trading down here on its lows. And while we remain below the 50 and 100-day moving averages, I think we have to remain defensive, and I think we’ve got to be prepared for the possibility of further weakness over the weeks ahead.
Let’s just go back to the hourly chart for a moment. We’ve got the market again sitting on some support. The support comes in around 4,130. It takes in these lows from a few weeks back. The tested that level on Wednesday/Thursday in the U.S. We are back down on support now.
Let’s put the Fibonacci retracements just on this leg lower that we had last week, and you can see that rebound that we had was back to the Fibonacci range. It’s a case of, at the moment, the rallies are being sold. We still have that distributive-type price action going on in the S&P 500. And so that’s why it looks like this has further run on a short-term basis.
I think we could be nearing some point where we do get a bounce. Maybe it coincides with this support level. Maybe it comes in a bit lower because what I want to show you is the number of S&P 500 stocks which are below their 20-day moving average.
You might remember we looked at this a few weeks ago after that big 12% rally and we said that the market is probably going to top up here and pull back. I think we were looking for a pullback of around 5%. Well, we got the 5% plus sum. There were so many stocks above their 20-day moving averages that it was at the point where the market was overbought and needed that technical pullback. And this has been one of the sharpest technical pullbacks we’ve had because now we’ve almost cycled back down into the oversold camp.
At the moment, there’s just 11% of S&P 500 stocks above their 20-day moving average, so put another way, 89% are below their 20-day moving average. As you can see, it doesn’t happen that often, and when it does happen, it doesn’t stay that way for very long. This was the COVID crash in here. It stayed locked down there for a few weeks. But often when it gets down here we get a bounce. So that’s why I say we could get some sort of a near-term bounce approaching but we’re below those moving averages. So I think the name of the game at the moment is play very much defensively.
And what we’ll do now, let’s go over and have a look at the NASDAQ because that’s a really important part of this as well.
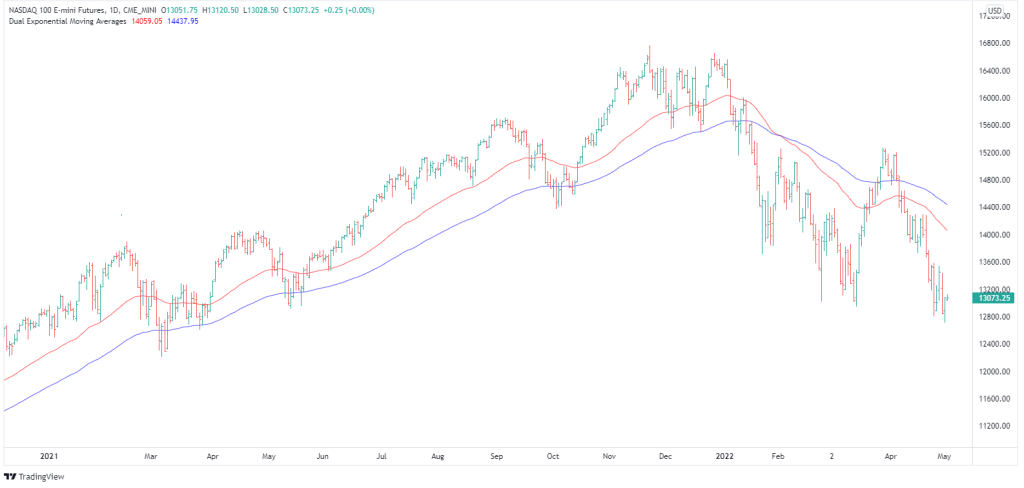
So the NASDAQ remains weak. There’s no two ways about it. We talked about last week that whilst it was below those moving averages, the 50 and the 100-day, we spoke about how it remained vulnerable and you can see why that was. We got that sell-off. That was all part of being vulnerable. When a market is vulnerable, it is more prone to negative surprises or just negative sentiment in the path of least resistance becomes to the downside.
And last week, I did mention there was a potential head and shoulders pattern forming. That gave us that possibility that maybe the market was going to have one more tilt higher before then rolling over and having a retest of these lows. But we didn’t get that retest. We just got the accelerated retest of these lows from back in March.
I think a stabilising factor for the NASDAQ has been some of those big mega-cap stocks like Apple, Microsoft, and Google. And if you take those out of this index and it would be a whole lot lower. We’ll get to that in a moment, but let’s first just have a quick look at these stocks.
Let’s start with Apple.
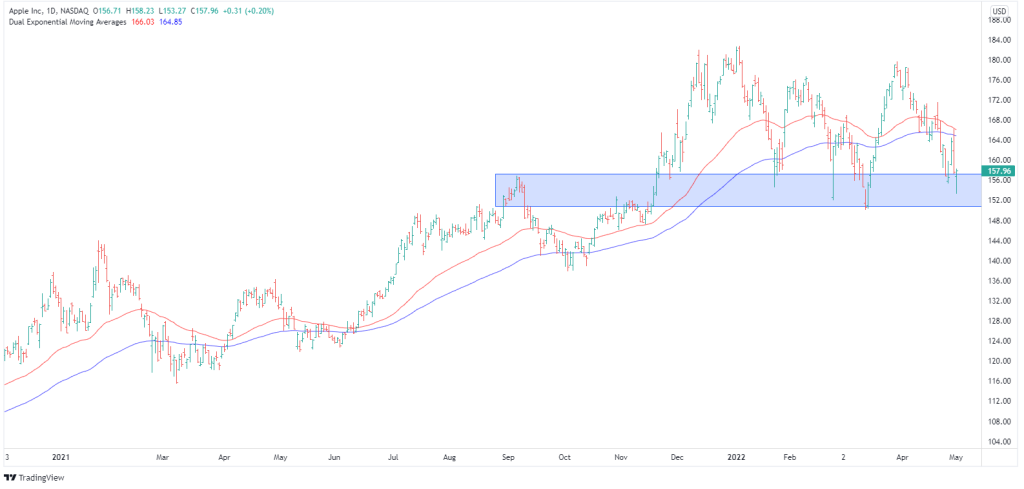
And what we see here is that Apple has been relatively strong. It’s been one of the strongest stocks in the S&P 500 tracking within this sideways range. What’s important for Apple is that we’ve got a support zone around about that $150 mark. So it’s really important for Apple to hold the line here and not break down.
The moving averages appear that they could be rolling over, and it is actually below the moving averages at the moment. So the vulnerability for Apple is that it does crack below this support and that brings more weakness into both the NASDAQ and the S&P 500. It does appear more likely that Apple will roll over. And that is, of course, going to be a big drag on the overall market, and that’s where we see the markets continue to decline.
Microsoft is important to look at as well.
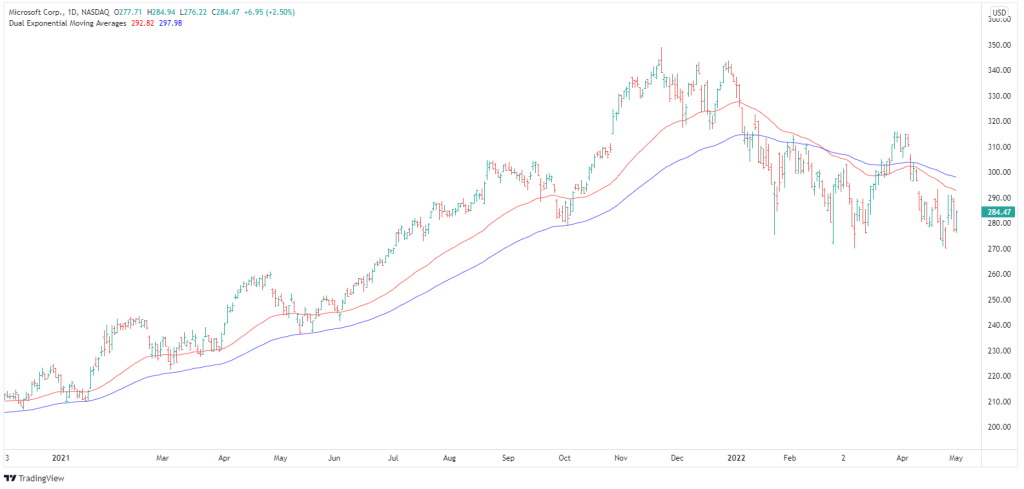
Another one of those big-cap stocks. We’ve got support around this region around $270/$275, and each time it tests, it’s just testing a little bit lower. I think we’re in a situation where we’re going to see Microsoft lose its footing. I think we’re going to see some lower levels here. It’s not set up in a situation where I don’t think it’s going to have a rapid fall, but it does look like lower levels are in the makings.
And just quickly jumping over to Google.
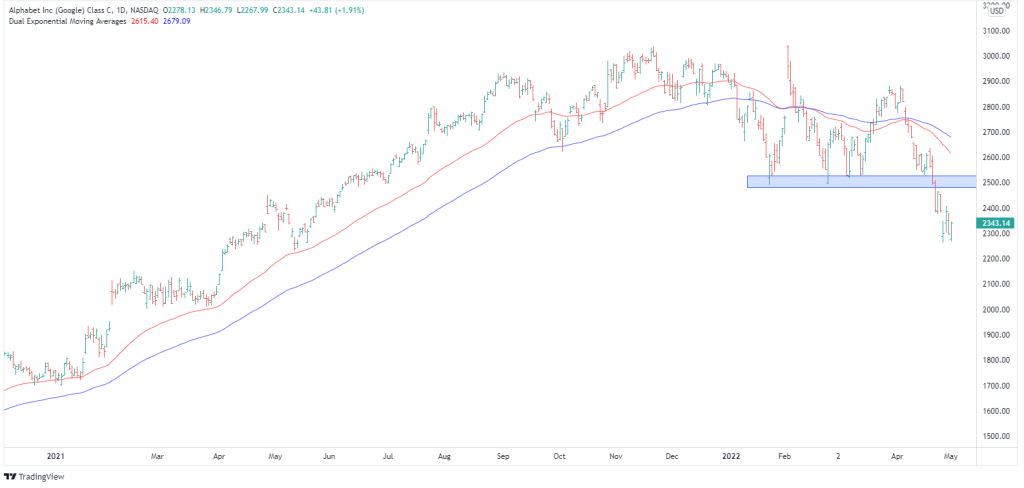
And what we see with Google is, well, it’s already lost its footing. We talked about Microsoft looking like it could be losing its footing. Just this week, we’ve seen Google crack below its support around $2500. The moving averages are now clearly declining. It’s at the point of vulnerability. So it’s certainly not the time to be buying the dip in Google. It’s one to sit back and watch. If I owned Google, I’d be exiting. If I didn’t, I’d be sitting on the sidelines and I want to see how this all plays out because it does have implications for the overall market.
Internally, there’s been a lot of damage done in the Nasdaq. We’ve spoken about this previously, and the damage has all been done in unprofitable tech. We looked at the ARK Innovation ETF about four weeks ago. This was a boom stock. It was the poster stock for tech during the COVID boom. It went from $31 up to $157, so huge gains. But look at the unravelling we’ve had. The downtrend was well and truly entrenched and it’s continued to peel away.
Have a look at this:
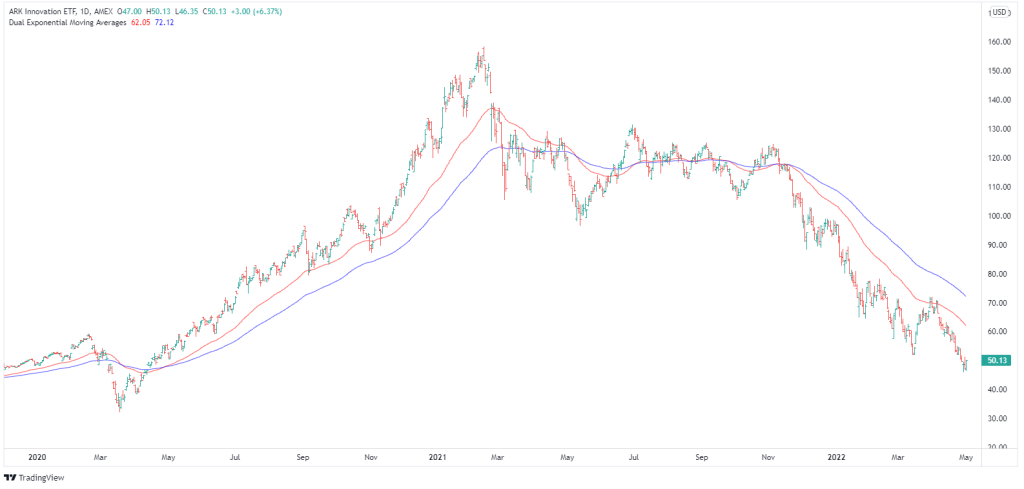
ARK is down 70% from its highs now. So when you look at the NASDAQ, many of the NASDAQ stocks are actually down over 60%, so it’s a full-on bear market in the NASDAQ. It doesn’t appear so on the surface because of those big tech stocks. It looks like a moderate correction. But when you go down into the breadth of the market, you’re seeing that there’s been a lot of havoc which has been wrecked upon some of these non-profitable tech companies. And so the money flow continues to be out. It continues to be leaving unprofitable tech and going elsewhere, so people who have been buying the dip all the way down have been savaged.
We keep talking about the time to buy the dip is when the market is above the moving averages and you get pullbacks. You get these pullbacks to the moving averages in an uptrend, and that’s when you could buy the dipped-in.
Once some of those moving averages are turned lower and the price is below the moving average, it’s sell the rallies. The game changes. A lot of people don’t realise that. They just keep fixated on buy the dip. Buying the dip through can be an absolute disaster, particularly if they don’t have an exit strategy. There could be some terrific buyers here at some point, but I’m just not interested in trying to pick a low because, at some point, when this bottoms, it could grind sideways for months before it does start to turn higher.
I think tech is a story for 2020, particularly for unprofitable tech. That story has now passed. As the cycle turns, there will probably be new leaders, there will be new opportunities. And I don’t think it’s going to be in this space again any time soon, but we’ll watch the price action and judge accordingly.
Where to invest now
Looking for the best ASX stocks to buy now, as well as off the radar ideas most people don’t know? Our algorithms scan the stock market daily for medium term investment trends. We then tell our members precisely when to buy shares. And most importantly, we tell them when to sell.
If you’re ready to get started, try a no obligation FREE 14-day trial of Motion Trader, and see what an algorithmic trading approach could do for you.
Meet Jason

I'm Jason McIntosh, the creator of Motion Trader. My career began in 1991 on the trading floor at Bankers Trust. Nowadays, I trade my own systems from home in Sydney.
Motion Trader is for investors who value robust analysis, data driven entry and exit signals, commentary, and education. I use engineered algorithms to identify when to buy and sell ASX stocks. No biases or guesswork, just data driven signals.