This Could Spark Big SP500 Rally | Episode 129
Where is the Stock Market Heading?
00:00 Intro
00:30 Big test for SP500 (watch this closely)
04:14 Avoid this classic mistake people have been making
06:16 This remains an area of concern for stocks
07:45 Could this cause the stock market to crash?
09:50 What would you think if you knew this in advance (I bet you get it wrong)
Transcript
Please note: Charts available from video
This video is going to focus on the S&P 500. I’m going to cover the ASX 200 as well as gold, copper, and uranium in a separate video (you can view that here). I’ve also got a graph for you that I think might surprise you, so make sure you stick around for that. As always, this is general commentary doesn’t take your personal situation into account. With all of that said, let’s get into our first chart.
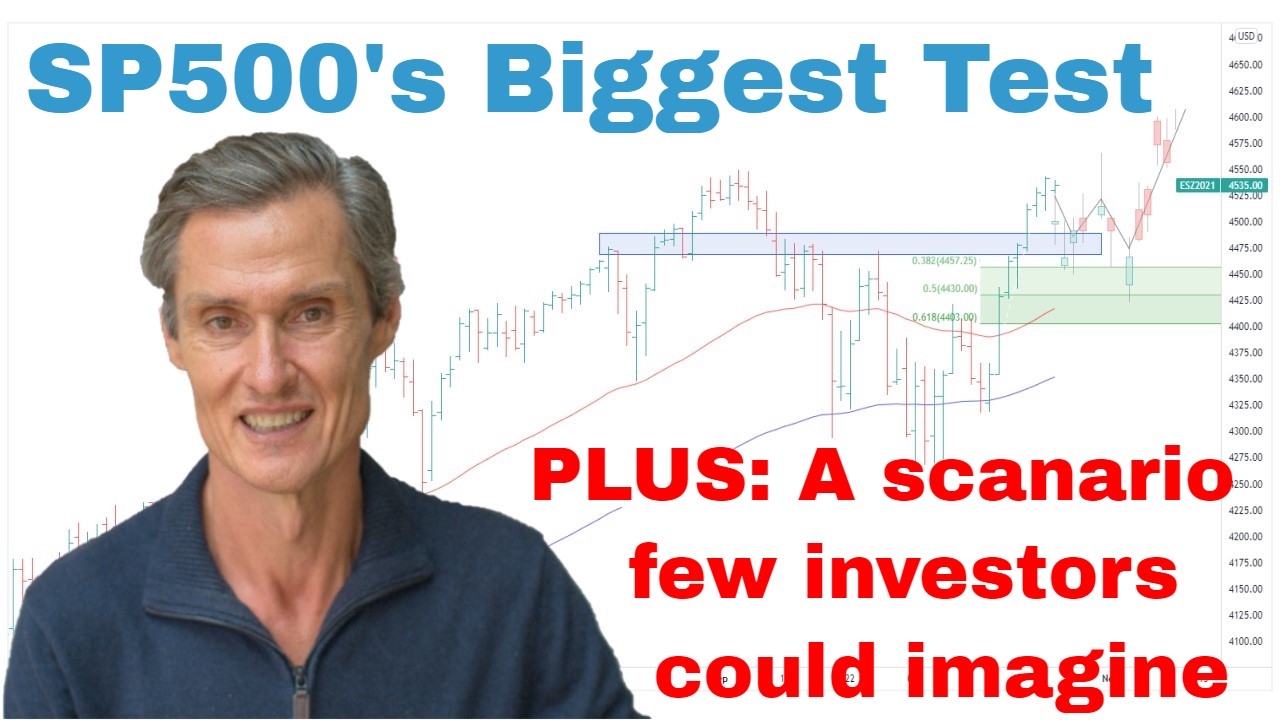
So S&P 500 up on the screen. And the price action this week has actually been quite constructive. Last week, I was talking about the possibility of more consolidation, and that was based on the market being just below this key resistance at around 4200. And that’s pretty much what we’ve seen over the last few days. We’ve seen this pullback back towards the moving averages. So, I’m looking at the 50-day and the 100-day moving averages. And as of Thursday, so I’m recording this on Friday afternoon in Sydney, as of Thursday’s close in the U.S., the market has pulled right back to these moving averages.
And we can also put on some Fibonacci retracements, which are always interesting to keep an eye on at some of these key points. So using the March low and the recent high, and you can see the S&P 500 has pretty much come right back to the top of the Fibonacci region at the 38.1% mark, which also happens to coincide with these moving averages. So, we have a few things going on in the same region.
And let’s jump over to the four-hourly chart for a moment just to get a little bit more detail on some of this recent price action. So, what I’m going to do, I’m going to take those Fibonaccis off for the moment. And what I want to do on this chart, I just want to look at another area of support which comes in around where the market’s trading at around 4050-ish, just above that key 4000 mark. And you can see we’ve had a number of times the market has been around this region, and it’s been an area which has found support or resistance, depending on which direction the market’s coming from. And here we are now, we’re right on that support. And you can also see we’ve got this classic zigzagging type of pattern, A-B-C consolidation. So, at the moment, you’d say that the rally off the March low has been impulsive. And so far, this pullback has been constructive. It’s been consolidative in the way that it looks.
Now coming back to the daily chart. So, I think the next key test for the S&P 500, it really is this big resistance band at around 4200. And not surprising we’re getting this pause at the moment because often as the market approaches these big resistance bands, if it’s going to get through, it tends to coil up and do some consolidation, form some sort of a launching pad before testing and then potentially breaking above the resistance. And that’s I think what we’re doing now. We’re consolidating before potentially another retest.
We’ve had broad upward momentum really since October. And I think that broad upward momentum, we’ve got to say remains in place, particularly while the S&P 500 remains above these moving averages. At this stage, I think the odds favor…we’re going to see a retest of 4200, and I think the odds favor we’re going to get a break above it. How far the market runs, if that happens, who knows? We don’t know. We just need to play the price action as it comes. And that’s what I’m looking up for over the next couple of weeks for the S&P 500.
Going over and having a quick look at the NASDAQ 100. And we’ve got this same broad positive structure. NASDAQ actually hit a new 10-month high during the week only by a whisker, but nonetheless, a 10-month high. And a really interesting thing is people have been calling it into this bear market rally. Maybe it’s a bear market rally, maybe it’s not. We’ll only know that in hindsight, but people have been calling it into this bear market rally since…we can go back to October last year and all the way up. Just think of all these times where people were saying, “Oh, the bear market rally, it’s rolling over. This is the time to get short.” Market keeps marching up. A new 10-month high.
Now, of course, this market could top at any moment. It could turn lower. No one knows. No one’s got that crystal ball. But the point I want to make is that betting against momentum is it’s just a risky play because momentum can’t last a lot longer than people typically believe possible. Who would have thought the market would have been making a 10-month high when we were back in the fear and worry of November last year? It just didn’t seem a likely scenario. So, keep an open mind. And I think the play in pretty much every market is go with the trend. Don’t fight the trend. Fight the trend at your peril because these trends, they can just defy a lot of people’s expectations.
Now, I want to just talk about risk in a moment, but before I do that, if you’re getting some value from this video, please hit that like button. Leave a short comment, “Hey, thanks for the video.” It just tells YouTube you’re watching and engaging, and YouTube does its thing and shows other people. Hit the subscribe button if you haven’t already done so. And visit me over at motiontrader.com.au, see the work I’m doing with trends, trends identification, see if that could help with what you are doing. All that helps me a heap. So, start with that like button. Please hit that like button.
Now, I want to have a quick look at the NASDAQ equal-weighted index. And this remains one of those areas of concern. We still got a situation where the equal-weighted is trading below the moving averages. We’ve got the 50 and 100-day moving averages. The S&P 500 equal-weight is trading below those. And it’s also in the middle of the range. We got bounded by these green horizontal lines. We’re pretty much smack center in the middle of this broad range that has been in going back to around June last year.
The other thing to note is that we’re also a long way from the recent high. So, you think about the S&P 500, it’s closing in on a 10-month high. Look at the equal-weighted, it’s doing nothing of the sort. So, it’s really a case of those big stocks pulling the market higher, which really isn’t ideal from a broad-based market rally perspective. And I think this is why the play remains cautiously long. It’s don’t fight the momentum, don’t bet against the momentum. But I think you just got to be careful. You’ve got to be mindful that not everything is lining up at the moment. The best times to make money are when you’ve got that broad participation, and that’s just not what we have at the moment.
Another thing I’m keeping a close eye on are the small caps. And in this situation, I want to focus in on the iShares Micro-Cap ETF. Correlates quite closely to the Russell 2000. But what we have going on in the small caps which is noteworthy this week is that they’ve made a new two-and-a-half-year low, which is quite interesting considering where the NASDAQ 100 and the S&P 500 are, a new two-and-a-half-year low. And what’s going to be interesting here is they’re in a vulnerable position. So, 50 and 100-day moving averages, it’s been… This ETF, the micro-caps, has been sitting below those moving averages for several weeks now. So, that puts it in a vulnerable position.
So, the big question now is, are we going to get follow-through selling whilst this market is…? It’s effectively on its knees at the moment and it’s trading right near that two-and-a-half-year low made this week. Are we going to get the follow-through selling? And do we get the big hit which sends this market lower? Now, if we got that, presumably that’s going to be negative for the market overall.
But the thing which I’m watching and the thing which is interesting is that often you get a situation where a market does…it makes these new lows, these significant lows, but it does so on declining momentum. Now just look back to September, October. We had a situation where the market made new lows, broke below the previous low from June, had a couple of cracks at it, but couldn’t get that follow-through momentum, and we got the rebound. That’s what I’m watching. I’m wondering whether…can the market find support around here if there’s no follow-through selling and get a rebound, which would be, of course, supportive for the market overall? So, I don’t know what’s going to happen, but I do know that’s a possibility. We’ve got support from this declining trend line. Just one to watch. Keep an eye on this one, see what it does over the next week. Also, follow the Russell 2000 for the same price action.
Now, one last thing I want to talk about. I want to look at the NASDAQ Bank Index. Now this is really interesting. So, as you probably know, there’s been all sorts of trouble with these regional banks, and this index has been hit hard over the last month or two. Now, just say you didn’t know what the S&P 500 had done this year. You’ve been offline, you don’t have a clue what the market has done and you see this chart of the NASDAQ Bank Index. Now, what would you think the S&P 500 have done? And I think the obvious answer did say, “Well, the market must have crashed. This is awful.” Now, of course, that’s not what’s happened.
So, here’s a chart, here’s this bank index again, and here’s S&P 500. So, while the bank index has collapsed, S&P 500 has moved higher. Gradually, but nonetheless, it has moved higher. So, what’s interesting with this is so much negativity has been thrown at this market but it continues to defy the predictions for a crash. I think that if the S&P 500 were going to crash, at least in the near term, it would have gone down with the banking index in March. It wouldn’t have been grinding higher. So, there’s still risk in this market. It’s still a time for caution, but if we get a situation where this banking index starts to stabilize, maybe it takes away one of those pillars of negativity. So, it’s just one of those things to keep an eye on.
And just briefly on this banking index. Let’s just put it on a weekly chart, and let’s put it on a log scale. This allows you to look at prices over time. And this data goes back to 1974, so even can’t get that to… There we go. You can see it goes back to 1974. That’s around a 50% decline. We’ve got another big decline in the late ’80s of around that 50%, 55% mark. Here’s the GFC down 66% I think it was. Another 50-odd percent blow in the late 2010s. And now we have this one which is around 52%. Now, what’s interesting here is the latest sell-off is up there with the biggest in the banking index’s history. And if it matched the GFC, it would just need to get back to these lows from COVID, which really isn’t that far away. So, what’s going to happen here, I don’t know. And this isn’t a prediction by any means. It’s just one of those interesting things to keep in mind.
A lot of negativity around banks. Is this going to be as bad as the GFC? Time will tell. But my thinking is if this index was to stabilize somewhere around this historic sell-off region that it currently is, as I was saying earlier, it may just take away one of those pillars of negativity for the market in general. One to watch, one to keep an eye on, one to keep some perspective with from a historical standpoint.
So, thank you for joining me. Been great having you. Come back and join me next week, and I look forward to talking to you then. Until then, bye for now.
Please see video for more detailed analysis and charts
Looking for the best ASX stocks to buy now?
Motion Trader‘s algorithms scan more than 2,000 ASX stocks daily in search of medium term investment trends. We then tell our members precisely when to buy shares. And most importantly, we tell them when to sell.
Try a no obligation FREE 14-day trial of Motion Trader, and see what an algorithmic trading approach could do for you.
Meet Jason

I'm Jason McIntosh, the creator of Motion Trader. My career began in 1991 on the trading floor at Bankers Trust. Nowadays, I trade my own systems from home in Sydney.
Motion Trader is for investors who value robust analysis, data driven entry and exit signals, commentary, and education. I use engineered algorithms to identify when to buy and sell ASX stocks. No biases or guesswork, just data driven signals.