SP500 Goes Parabolic – Risk Warning | Episode 141
Where is the Stock Market Heading?
00:00 Intro
00:30 Should you buy SP500 at current level?
05:36 Dow ticks another box for the bulls
06:00 Is the Nasdaq going parabolic?
08:13 Look what this indicator just did (big development)
09:16 This has been the missing link for the bulls
10:14 Watch this key market closely (critical levels)
Transcript
Please note: Charts available from video
This video is going to focus on the S&P 500. I’m going to have a look at the ASX 200 as well as gold and uranium in a separate video (you can view that here). I’m also going to show you another chart. It’s a chart of a very important market which is at a critical level, so make sure you stick around for that. As always, this is general commentary. It doesn’t take your personal situation into account. With all of that said, let’s get into our first chart.
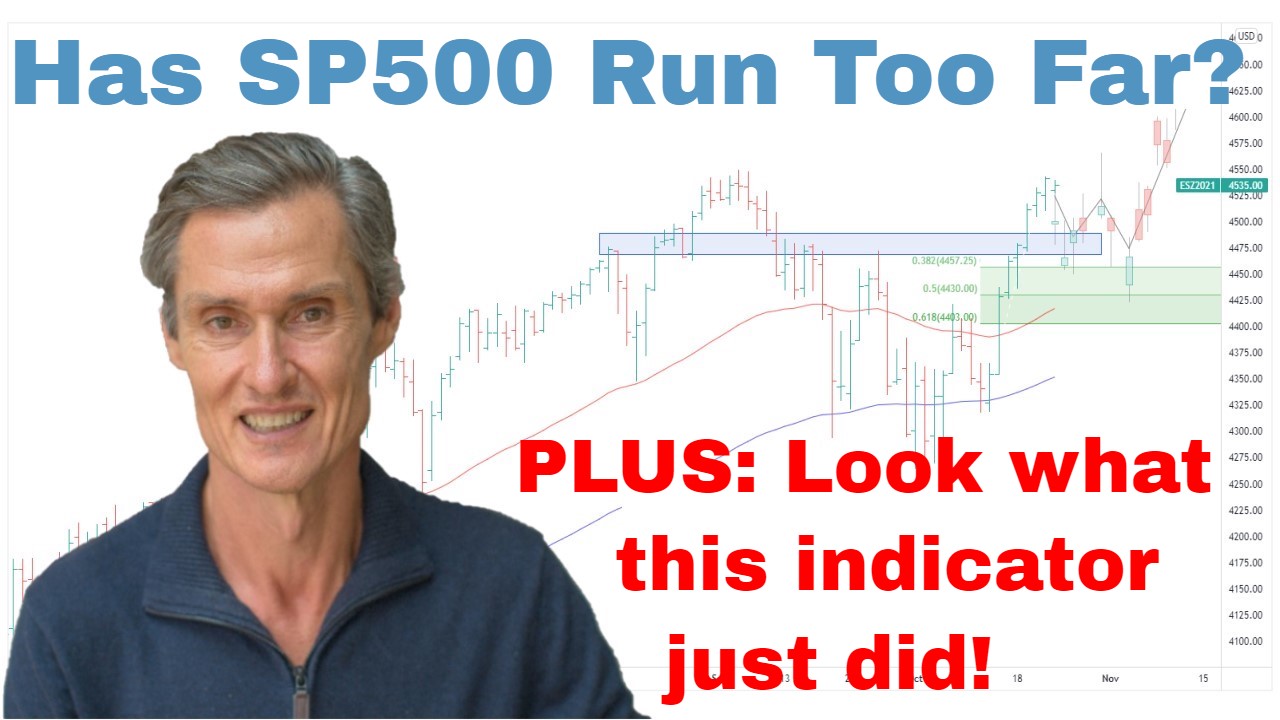
So, we’ve got the S&P 500 up on the screen. And this has really been a big week for the market in that we’ve seen the S&P accelerate away from the breakout that we saw about three weeks ago. So, we’re really seeing this momentum start to build. And we also got the S&P 500 trading up at a 14-month high. So, you got to go all the way back to around April 2022 to get the S&P 500 at this level. So, it really has been a good week.
And I spoke last week about the potential of using this breakout as an area to add to a position or maybe for people who didn’t have positions, people who have been watching the market through this section from October all the way through to May, people who have been hesitant to get back in, a lot of people expecting another decline. For those people, the breakout also presented the opportunity to maybe get a foot in the door and establish some type of position.
That’s what I did myself. I added to a position. So, I have an initial position from back around October last year, which I’ve told you about many times in the past. And I actually topped it up a little bit last week, about a week ago on this breakout. And I think that the way I look at this now it’s I don’t think the current levels we’re at would represent an asymmetric entry point. And by asymmetric, I mean an entry point where your potential upside is greater than your potential risk.
And I had a viewer who asked me about this last week. He said, “Can you explain what you mean by this asymmetric when you talk about entries and exits?” And we just take this point from a week ago where the market was trading late last week. And for an asymmetric entry point, you look at this and go, “Well, okay.” You could take a position around just after the breakout. You could use some risk management and have an exit point just back within inside the range. That might be, like, a 2% or 3% of risk.
And the potential upside when a market breaks out of a big range is usually the width of the range. That’s not a guarantee of where it’s going to go but it’s a guide. And that projects up to around 4,800. So, that’s something like 12% above the breakout point. So, you say 2% risk, 12% upside. That’s 6 to 1 risk reward. That’s pretty good asymmetric risk reward to take on board. Whereas entering at the current level, well, the risk is a lot potentially greater depending on where you use your exit level and your upside.
If you’re using a 4,800 target, it’s about 6% as opposed to 12%, so maybe you’re looking at around 2 to 1 risk reward. So, it’s not quite as attractive. Still positive, but just not as good as what it was when we had the breakout. So, that’s what I’m looking for. I’m looking for these asymmetric entry points. We’re now about 5% above the breakouts.
So, now look at this. So, look where the moving averages are. I’m looking at the 50 and the 100-day moving averages. And the market is somewhat stretched above these averages. It would be quite natural to get some sort of a pause in the price action, potentially build a new base, consolidate, and then possibly from there, we look for another extension higher.
Notwithstanding the potential of some consolidation in this S&P 500, I think the play remains on the long side. I think trying to be too clever, trying to pick consolidation points, buy back in, run it again, I think it’s really difficult to do. I don’t think too many people consistently make a lot of money by doing that. I think the better play is just to use this broad-based momentum, try and stay with it for as long as possible, as long as it stacks up from a risk perspective.
And I definitely don’t want to be fighting this trend. I think there’s more bullishness coming into the market now. The sentiment isn’t as negative as it was over the last several months. But even though there’s a more bullish tilt, I don’t think sentiment suggests that we should be going all-out contrarian and trying to pick a top and get out. I think the play is not to fight this trend. Let the price action do what it does.
It’s really interesting because often price action doesn’t make sense. Often the price action doesn’t fit with the headlines or the news articles contrary that you hear. But I think rather than trying to trade off the back of what you see in the headlines, just trade off the momentum. The thing is we don’t need to understand why a market is moving. We simply need to identify the movement, and then use risk management strategies to potentially profit from it. I think that’s been the play and remains the play in the S&P 500.
Having a quick look at the Dow. It broke higher above this downward trend line over the week. So, it’s up above the April high, above the February high. Now testing the November 2022 high. So, I think this is positive price action in the Dow. Again, there may be some consolidation following the breakout, but I think the path of least resistance remains to the upside.
Jumping over to the NASDAQ. Well, the NASDAQ’s been such a strong market, and it’s had another strong week. I think this market really does need to pause and consolidate. You just look at how stretched we are above the 50 and the 100-day moving averages. And I spoke about asymmetry earlier in terms we want to look at points where you can get into a market and your relative downside is much smaller than your relative upside.
And I just worry about the S&P 500 establishing new positions, new risk at current levels. I’d rather see some sort of a consolidation and get a new idea of where my exit point could be if the market pulls back. It also has that parabolic look to it at the moment. Well, at least it’s starting to get that parabolic look. You can put in an arc and you can see that over the last few months, you can see this curve is getting steeper and steeper.
So, it’s getting that parabolic element, which is often not sustainable in the market. Parabolic moves often lead to abrupt pullbacks. So, if this market were to continue up at its current rate, it does really increase the risk significantly of some sort of a significant pullback. I’m not talking about a reversal of the trend. I’m just talking about a pullback.
So, from that risk point of view, I’d rather wait for a consolidation rather than entering the market at this point. That said, though, trend is in place. Any positions I’m holding in stocks, in trending stocks, I want to hold onto. I’m going to talk in a moment about another important development in the market, and that’s to do with participation with the breadth in the market. But first of all, if you’re getting some value from this, please hit that like button.
Please leave a short comment, just, “Hey, thanks for the video.” It just tells YouTube you’re watching and YouTube shows other people, and that helps me a lot. So, please do that. And also hit that subscribe button if you haven’t already done so. Maybe visit me over at motiontrader.com.au and see if what I’m doing with trend identification might be able to help with what you are doing with your portfolio.
And now let’s jump over to something else which has been interesting through the week. And this is this indicator, the NASDAQ 100 stocks which are trading above their 50-day moving average. And for the last seven or so months, the number of stocks above their moving average has been contracting. You can see the boundaries of this range. And we’ve been at the point where it’s only about half the market, just above half the S&P 100 stocks have been above their 50-day moving average.
So, this is where I’ve been talking about the breadth issue in the market where the gains have been driven only by a small number of stocks. We’ve now got a breakout just in the last week. It’s now 80% of stocks above their 50-day moving average. Now, this is a positive sign because it shows that more stocks are participating in upward trends, and that’s what we need for a healthy market. We need that wide, broad, spread participation. And that’s what this is suggesting now. So, I think this is a tick for the market.
And also through the week, just watching the Russell 2000, so the small caps. And it’s been the small caps have really been lagging. It’s been those big stocks, a few big stocks leading it. And what’s been encouraging through the week is that the Russell’s been able to hold onto these gains from a couple of weeks ago. Sideways consolidation, moving averages are turning higher.
When I compress this chart, this is looking more and more like a basing structure that the market could leverage higher from. And we still have overhead resistance coming in at around 2000. Well, it’s too early to call a breakout, by any means. It’s way too early because the breakout hasn’t happened. But it’s starting to structure like it’s a base that could lead to further strength towards the top of the range and then potentially out of the range.
And that’s what we need. These healthy bull markets that have broad participation, not just a few NASDAQ stocks. There has to be broad participation for a healthy bull market. Now, I just want to wrap up with one last thing, and this is the U.S. 10-Year Government Bond Yield. Really interesting in that for the last seven months, it’s been trading sideways.
We saw a big increase in yield through 2021, 2022. The last seven months, we’ve been going sideways. It’s a compression range. It looks like a type of a flagging formation which is contracting. So, you get a strong move and then you get a sideways. And then quite often you get another strong move. So, this is an interesting thing to consider. What happens if the bond yield breaks higher from this pattern, starts heading up towards 5% where there’s some overhead resistance? Hasn’t broken out as yet, maybe it won’t break out.
But at the moment, it is trading up towards the upper resistance band. The moving averages have crossed, they’re trending higher. The yield is above the moving averages. So, this is one to keep a close eye on. A breakout could be a cause for consolidation in equities. Hasn’t happened yet, I stress, but it’s one of the things that we need to be aware of because maybe this is a trigger for some sort of a longer consolidation. Again, I’m not talking about a reversal of the trend but a consolidation in the equity markets.
So, let’s leave it there for this week. Thanks for joining me. Hopefully, that’s been interesting. And I look forward to coming back and talking to you next week. Till then, bye for now.
Please see video for more detailed analysis and charts
Looking for the best ASX stocks to buy now?
Motion Trader‘s algorithms scan more than 2,000 ASX stocks daily in search of medium term investment trends. We then tell our members precisely when to buy shares. And most importantly, we tell them when to sell.
Try a no obligation FREE 14-day trial of Motion Trader, and see what an algorithmic trading approach could do for you.
Meet Jason

I'm Jason McIntosh, the creator of Motion Trader. My career began in 1991 on the trading floor at Bankers Trust. Nowadays, I trade my own systems from home in Sydney.
Motion Trader is for investors who value robust analysis, data driven entry and exit signals, commentary, and education. I use engineered algorithms to identify when to buy and sell ASX stocks. No biases or guesswork, just data driven signals.