Is SP500 Topping Important New Evidence | Episode 139
Where is the Stock Market Heading?
00:00 Intro
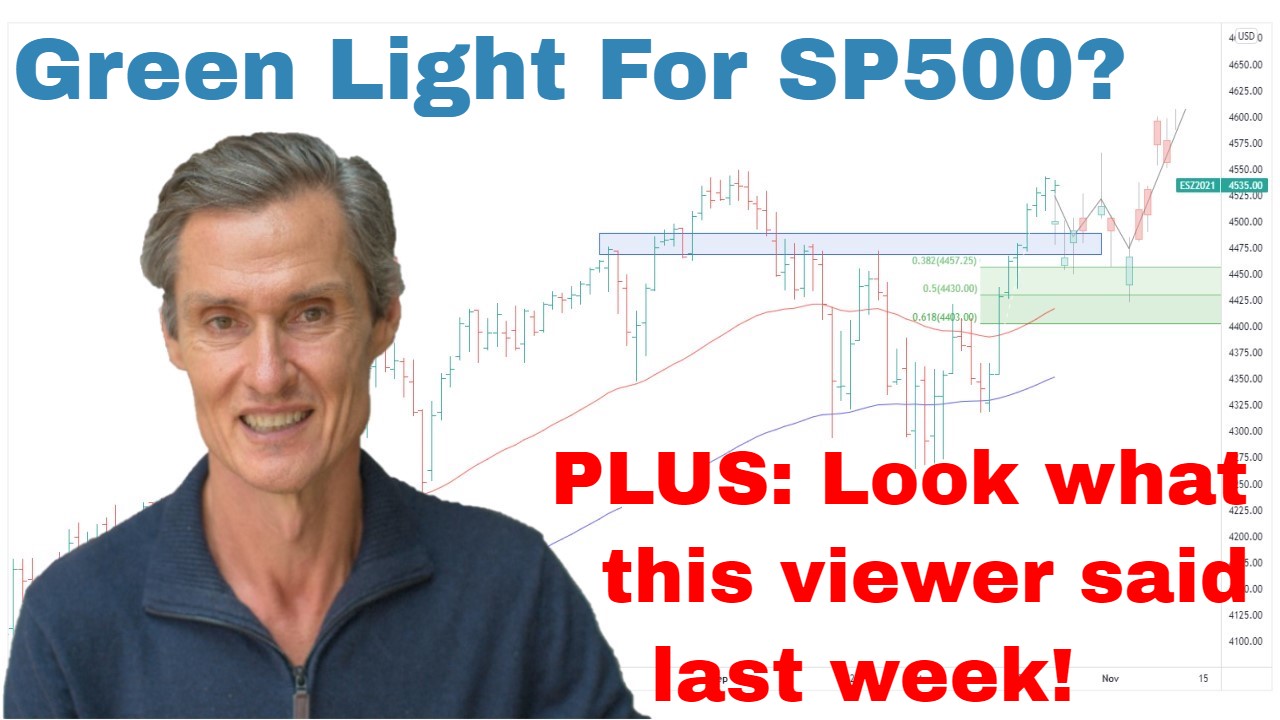
00:30 Is this a green light for the SP500?
04:05 Classic structure in the Dow (this is what it means)
06:25 Look what the Nasdaq just did
09:16 Is this the missing piece of the puzzle?
10:55 Look what this viewer said last week
Transcript
Please note: Charts available from video
This video is going to focus on the S&P 500. I’m going to cover the ASX 200 as well as gold and uranium in a separate video (you can watch that here). I’m also going to show you a comment from last week’s video, which I have to address, so make sure you stick around for that. As always, this is general commentary. It doesn’t take your personal situation into account. With all of that said, let’s get into our first chart.
So, here we have the S&P 500 up on the screen. And it’s been a really big week, a really important week I think for the stock market because we now have this decisive break above key resistance at 4200. So, you can see this blue line marking the top of a large trading range, which the market has been in for around 12 months, and we now got this decisive breakout. So, it’s been really interesting over the last couple of months because there’s been several attempts for the market to sell off just beneath this resistance point, and each time there’s been a strong reaction higher.
And also what we’ve seen over the last I think probably two, three weeks is this rebound off the 50-day moving average, which we also saw back in May and April, so the 50-day moving average tracking higher, and the market rebounding off it. So, they’re positive signs. I think they’re positive signs that there is buying interest supporting these pullbacks and underpinning the market. And we now find that the S&P 500 is trading up at a 10-month high.
Now, the play, if you’ve been watching these videos over the last 6 months, 12 months, whatever it may have been, the play over the last 8 months, pretty much since this CPI release back in October, the play has been cautiously long. And it’s been cautiously long because there’s been plenty of cross-currents, and conflicting signals in this upward move, in this upward momentum. But I think the breakout that we have from last week, I think it’s another green light for this general upward momentum that the market’s been seeing. And I think the people who have been sitting on the sidelines, people who have been watching this rally, people who haven’t been participating, I think this provides another opportunity to potentially get some sort of a stake in the market, or potentially add to a position for people who have been in the market and wanted to add, but didn’t want to add potentially whilst it was sitting just below a resistance area at 4200.
So, it’s a really interesting week in the stock market to see this breakout. And it’s been encouraging over the last week that the market’s been able to hold onto these initial gains, and we’ve had this tight consolidation over the last few trading sessions. It’s going to be interesting to see whether… I think it’s quite possible this market continues to consolidate this breakout before potentially breaking higher again, trending higher. But I think whilst we have this upward momentum in place, we’ve got the breakout above resistance, I think the clear play is to continue giving this momentum the benefit of the doubt despite what we’re seeing in the economy, the inflation, the rate rises, the talk of recessions. It doesn’t sound like a positive environment for stocks, but the market presently is telling us something different. So, that’s the momentum that I want to play with. I don’t want to trade the headlines. I want to trade the momentum.
And now I just want to jump across to the Dow. That’s got its own really interesting story to tell. At the moment, we’ve got the Dow testing resistance from this downward trend line. Now, the trend line is not a perfect fit. You’ll see that the market broke above it in May. There’s a blip above it in December, but we’ve got a few touchpoints on this trend line. So, I think it’s a point of reference, which is worth keeping an eye on.
And we’ve got a situation now. So, when I look at this, we’ve got a situation where the Dow is bouncing off support, so the support zone around 32,000, thereabouts. We’ve had a bounce above there. We’re above the 50 and the 100-day moving averages after a test beneath it, and we’re testing this downward trend line. What I’d like to see, I’d like to see this series of lower lows broken, and that’s something we could potentially see over the next week or two.
It’s also interesting when you step back and you look at this on a weekly basis. So, when you do this, it just helps to put it into some context. So, we had the big bearish decline from December ’21, but from that October low, we had a really strong rally in the Dow. And since around November ’22, we’ve just been tracking sideways. It actually looks like a bit of a flagging formation. It’s not a textbook flagging formation because we’ve got a break below this lower line, which I’ve drawn. But nonetheless, you’ve got a strong rally, and a compression-type sideways consolidation.
So, the way I’d look at this chart is that I think we’re more likely to see a test of the January ’22 high than a test of the October ’22 low. We’re midway between those two points at the moment. And if I had to say either way, this is the one I’m currently looking at. Strong rally, sideways consolidation often leads to another strong rally. So, let’s wait and see. We need to wait for the levels to break first. They haven’t happened yet, but that seems to be the way this is currently playing.
Let’s jump over to the NASDAQ 100. Now this has been really leading the charge for many months now. And I spoke last week about… I thought the best-case scenario was for the NASDAQ to pause and consolidate, let these moving averages catch up, the 50-day and the 100-day. That’s what we’ve seen over the last few days. On Wednesday, we got a bit of a downside day, and there was some buzz on some of the Twitter feeds that, “This is it. The market has peaked. It’s turning lower.” From my perspective, this is just part of potentially just a pause. You don’t get bearish after one day. That’s just crazy talk. At the moment, the momentum is clearly to the upside, but a pause would be constructive, and then allow the market to form a new base before potentially then trading higher again. Let these moving averages catch up.
Now, one of the really interesting things I want to talk about is this line down here, what I’ve got here. This is the advanced decline line for the NASDAQ. And a big issue we’ve had, a big issue I’ve been talking about over the last few months has been the lack of breadth in the market. So, the rally has been really led by a handful of stocks, potentially around seven stocks. Seven big market-heavy stocks have been really driving all the gains. And when you look at the advanced decline line, well, we’ve had the NASDAQ 100 making higher highs. The advanced decline line has been not doing that at all. We’ve got a high point in February, and then we’ve got a lower high in April, and then another lower high in May despite these higher highs in the NASDAQ 100.
What’s been interesting over the last week or two is that we now have a situation where for the first time in ages, we’ve got the advanced decline line breaking above some previous highs. So, early days, but this has definitely been the weak spot in the market. This has been the area of causing the greatest concern as to the sustainability of the rally, but this is an encouraging sign. It’s a sign that maybe we’re getting some more participation coming back into this market.
Now, I’m going to talk a little bit more about another important development on the participation side in a moment, and I’m also going to show you that comment from last week’s video, which I was talking about. But first of all, if you’re getting some value from this, please hit that like button. Please leave a short comment, just “Hey, thanks for the video.” It just lets YouTube know that you’re watching, you’re engaging, and YouTube does its stuff, and shows other people. It helps me heaps. Please do that. And hit that subscribe button if you haven’t already done so.
Now, let’s jump over to another really interesting development this week, and this is in the Russell 2000, the small caps. Now, the big piece of the puzzle missing over the last few months has been the lack of participation. The lack of breadth from the market. What we’ve had in the last week in this NASDAQ is we’ve had a strong upward move. This has been an 8% rally in about a week. We’ve gone from trading below the moving averages, below the 50 and the 100-day moving averages where it’s been stuck beneath since early March, and we’re now back above the moving averages. The moving averages are starting to turn higher. We’re still within a broad range. So, let’s not get ahead of ourselves.
This is still a big range-bound market, but we do have the potential of a rounding base over the last few months, and this could be the start of a larger basing pattern. This could potentially be a larger rounding base, which has been tracing out over…that goes back to May ’22, so over the last more than 14 or so months now. Maybe. It’s just maybe this is now starting to gain some traction on the upside. So, this is one of the things we want to watch, but it is a sign of breadth spreading out from beyond the NASDAQ 100. And we want to see… Healthy bull markets are all about broad participation. So, we want to see that strength in the NASDAQ 100 spreading out across the market generally.
Now, let me show you this comment from last week. These are the comments from last week’s S&P 500 video. And Tom left me a comment. He said, “Market falls, you’re scared and cautious. It rises, you’re scared and cautious. Mate, how are you going to trade?” And he goes on to say that, “Just invest. Leave it in there. Ride the bull trend. Don’t overanalyze. Don’t think too much. No one’s smarter than the market. Follow the upward momentum. Make money. Simple.” There are some sensible comments there. I think it’s sensible. Don’t overanalyze. Don’t overthink. Don’t think you’re smarter than the market. Follow upward momentum. I like all that. That makes a lot of sense. But this talk about being scared and cautious, well, I don’t know where scared comes from. I don’t think anyone in the market is a type of a scared personality who’d never be able to sleep at night, but cautious.
I’ve got to tell you, I’ve got to disagree with Tom on why am I cautious when the market on an up day and a down day? In the last eight months, it’s been cautiously long. That’s what I’ve consistently said. And no apologies for saying cautious because that’s the way I’ve seen this market. And my response to Tom was, “There’s a time to push hard, there’s a time to sit it out, there’s a time to be cautious.” And you see, upward momentum is great. We want to trade that upward momentum. And in hindsight, we should have gone all in long at the October low, but the thing is we don’t trade in hindsight. We trade in real-time. And you’ve got to respect risk. People who don’t respect risk, really, they’re on a ticking time bomb to leaving the market. And I think the reason we’ve been cautious in the last eight months, at least the reason I’ve been cautious, is there have been so many conflicting signals. We’ve had lack of breadth, there’s been cross-currents. It hasn’t been a clear-cut bullish trend, but there’s been good reason to participate.
And it reminds me of a great quote from one of the traders I learned so much from early in my career, a guy called Ed Seykota, one of the pioneers of systematic trend following. And Ed said, “There are old traders, and there are bold traders, but there are no old bold traders.” So, if you want bold all-or-nothing plays, I’m the wrong person for you. I’m here to help you win. And the other thing to remember is, though, I’m also here to help you stay in the game when you don’t win. So, that’s why you’re going to hear me talk about things like being cautious, not taking unnecessary risk, looking for asymmetric risk-reward situations where you can make more than you can potentially lose. The first rule of trading, stay in the game. And if you’re going to be taking these huge swings, and throwing cautious to the wind, you ain’t going to stay in the game.
So, hopefully, that’s been interesting. Thanks, Tom, for your comments last week. It’s a really interesting talking point. And yeah, look forward to coming back, and talking to you next week. Till then, bye for now.
Please see video for more detailed analysis and charts
Looking for the best ASX stocks to buy now?
Motion Trader‘s algorithms scan more than 2,000 ASX stocks daily in search of medium term investment trends. We then tell our members precisely when to buy shares. And most importantly, we tell them when to sell.
Try a no obligation FREE 14-day trial of Motion Trader, and see what an algorithmic trading approach could do for you.
Meet Jason

I'm Jason McIntosh, the creator of Motion Trader. My career began in 1991 on the trading floor at Bankers Trust. Nowadays, I trade my own systems from home in Sydney.
Motion Trader is for investors who value robust analysis, data driven entry and exit signals, commentary, and education. I use engineered algorithms to identify when to buy and sell ASX stocks. No biases or guesswork, just data driven signals.