Can This Base Launch ASX Stocks Higher | Episode 126
Where is the Stock Market Heading?
00:00 Intro
00:28 ASX 200’s best case scenario (it’s not what you think)
03:12 Here’s where I find many of my best ideas
05:15 This is what I’m doing (and the type of stock I look for)
08:19 Gold begins to pause. But is it time to buy?
09:38 Look at what uranium just did
Transcript
Please note: Charts available from video
This video is going to focus on the ASX 200. I’m also going to have a look at uranium and gold, so make sure you stick around for that. I’m going to cover the S&P 500 in a separate video (you can view that video here). As always, this is general commentary and it doesn’t take your personal situation into account. With all of that said, let’s get into our first chart.
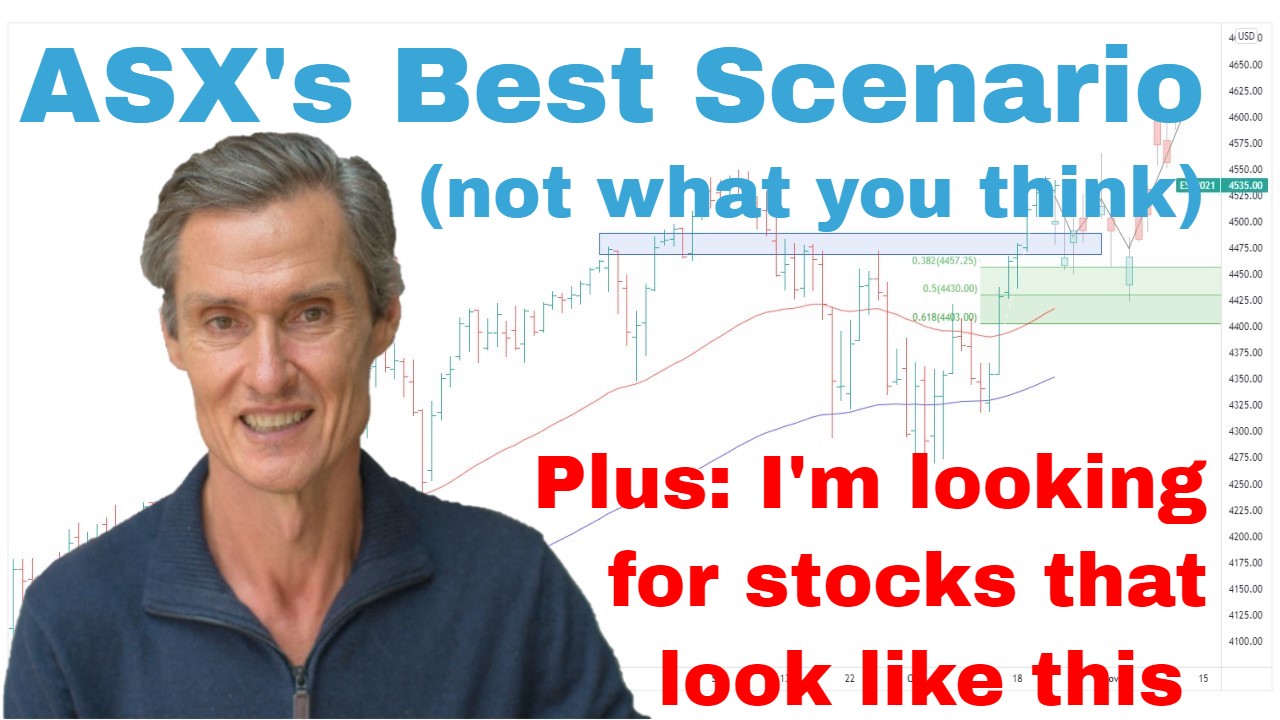
And we have the ASX 200 up on the screen. And it’s been another week of high ranges. Not a lot has been going on. And this isn’t at all surprising, consider that over the space of only about 4 weeks, the market put on 8%. So, that’s a pretty big rally to get in such a short space and time. And I think the best-case scenario here would be for the market to continue to consolidate over the next several weeks, maybe pull back towards these moving averages, back towards the 50-day moving average. General sideways motion will be quite constructive. And you might think, “Wouldn’t the best-case scenario be a quick rally?” But the thing is every good rally, every sustainable rally will be punctured by periods of consolidation. And you can see during previous rising periods, they all pause and they all consolidate. Consolidations are an important part of the process. Anything that goes straight up without a consolidation can often come down quite heavily. So, this is good. This is all constructive what we’re getting at the moment.
Regardless of what happens at the moment, the fact remains we’re in this 19-month sideways consolidation/correction, and it’s just difficult. We’ve been in this since back in…you got to go back to August 2021. It’s quite amazing when you think when this first started, had we known it was going to stretch out this long. And the thing is the length of these corrections, this is what it is. This is what they are. They can go on for over a year. And they’re difficult periods, but it is part of the cycle.
And the thing with these periods are that even good setups, so you might look at an individual stock and situation, it might look like it ticks all the boxes, but even great setups are more likely to fail when the market is in this phase. It’s just one of those times, it’s a case of waiting it out, not losing too much capital. Not too many people make a lot of money during these periods. The winner is often the person who loses the least and has the most capital when the market does break higher again. So, try not to get too discouraged. These periods pass. And if you’re finding it difficult, you’re not the only one. I find it difficult. Most of us find these periods difficult. Professionals have been doing it for years. It’s a difficult part of the cycle. Lots of uncertainty.
And the same goes when you look at the small ordinaries. This is an area which I always follow with a lot of interest because a lot of the best ideas that I see come from the smaller end of the market. And this remains very much in the trading range. You can see these green converging trend lines. Now this could well and truly be part of a big basing pattern that does turn higher and leads to some great gains, but we just can’t say. It could also be what we call a continuation pattern where you’ve got a decline, you’ve got sideways, and you get another decline. Hopefully, that won’t be the case, but it’ll be a case of not so much what we hope or what we want but what the market does. And we’re using the price action try and help guide us through whatever the eventuality is. Breakdown means we use risk management, we get out. Breakouts to the top side means more positions, more stocks trending, more money to be made. So, be patient. These breaks will come. We just need to wait.
But what is encouraging is over the last couple of weeks, this pullback so far has been quite shallow. So, that’s an encouraging sign that the dip is so far being bought. We’re above the moving averages. I’m holding an ETF position, a small-cap ETF. The ticker code is ISO. It’s an iShares small ordinaries ETF. Got it in the Superfund.
And I was talking a few weeks ago. I was thinking maybe I’d lighten that position up on a rebound. We got quite stretched below these moving averages. I thought maybe we get a rebound. I might just lighten that position a little bit with more cash. But we’ve got a strong rebound. We’re now above the moving averages. So, I’m still holding it and I’ll continue to hold it whilst we do have this encouraging strength of rally and shallow pullback. But I think just like the ASX 200, this probably needs more time to consolidate. But as I say, it’s encouraging that so far we’re seeing the dip being bought. The way I’m really approaching this current phase in the market is being really stock-specific. It’s a stock-by-stock exercise for me in the way I’m looking at what I want to put into the portfolio.
Now I’ll give you an example of what I mean by that. But just first of all, if you’re getting some value, please hit that like button. Please leave a short comment, just, “Hey, thanks for the video.” Just let YouTube know that you’re watching and YouTube will show other people, and it helps me heaps. And, of course, hit the subscribe button if you haven’t already. And visit me at Motion Trader and see what I do there if you haven’t already done so.
So now let me show you the setup that I’m looking for. This was really interesting. This is a stock called Codan. I think they make gold detectors and things like that. CDA is the code. Now this turned up in my Motion Trader scans only two weeks ago. And this is a turnaround situation I love the look for after we have had a big market decline. So, you’ve got the moving averages. I always talk about the moving averages. We had a crossover in the moving averages in March. And then I wait for shares to break to a 70-day high. And that occurred on the 11th of April. And so I got the signal, the Motion Trader signal send it out to members on the evening of the 11th. And then the 12th of April was the period to buy that stock. And not all stocks produce a signal and just rally straight away, but this one did. It’s been a great start for this trade. But this is the setup that I look for.
It’s not about trying to buy stocks as they’re declining. I don’t want to buy a stock when it’s below declining moving averages. And you look at these rallies that Codan’s had over the last year or two. There have been some good rallies but none of them have amounted to anything because they’ve all turned around and then fallen again. If you are using the moving average strategy, it can help keep you out of these stocks when the risk is against you, when the trend is against you, when you’re trying to move against prevailing direction of the price action.
And someone might say, “Oh, but look this point here, the moving averages crossed. Why didn’t you buy here?” This is why I’m using a 70-day high as a secondary cross-check to an entry position. So, the stock never made a new high after the moving averages crossed so there was no need to buy it, and then it [inaudible 00:07:51] again. This rally, of course, could have been like any other one, but now they’ve got the moving averages crossing. It starts to swing in favor of letting this trend run now and see where it goes. So, they’re the setups I look for with Motion Trader. Come over and have a look, see what I’m doing, see what the signals are like if you want a hand using some algorithms to pick this stock up because they can really lead to some nice gains.
Now let’s move on to a few commodities to wrap up with. So, we want to start with gold. We’re starting to get that pause, that consolidation that I’ve been talking about prematurely for the last few weeks. And, of course, as you’ll know, if you’ve been watching these videos, the reason I’m looking for a pause is we have this big overhead resistance zone at around 2080. My feeling is that this can lead to… Gold could be setting up for a significant rally over the next maybe one to two years, but given we’ve already had a big rally, maybe it needs to pause and consolidate first. It was also getting stretched above its moving averages. So, that’s another reason for a pause. I like gold. I’m holding gold. I’m holding my gold stocks. I’m just not rushing to add to exposure just yet. Who knows? This could take several months to consolidate, or maybe it rallies quickly, but if it rallies and breaks, well, then that’s probably the time to add some more exposure. But at the moment, my feeling is that this is going to take some time to consolidate this significant rally we’ve had from the lows.
And just going over to uranium. Really interesting week. So, last week, I was talking about how I was cautious on uranium with the price action just sitting below these moving averages. And now we have a situation where we’ve got a quick move to the upside. So, that’s really encouraging and it’s disengaged the risk we had with the market traveling in a range beneath the moving average. The risk, when that happens, is, of course, you get a break to the downside. But this break we’ve had to the top side disengages that risk. But this in itself I don’t think is cause to get too excited and to rush out and buy because we have seen this before. Here’s an example back in November, December where we were sitting below moving averages, then had a strong punch higher. Something similar back here in mid-2022, below moving averages and a strong punch higher.
The fact is that we’re still in this range which is bounded by these blue-shaded regions. We can just compress this up a little bit. And this range has been in place since…depends how you want to measure it out, but I think it’s been in place since September ’21. So, we’re coming up to two years within a sideways range. Maybe it’s going to be a case of uranium runs for a bit, and then comes back within the range. We don’t know. I’m waiting for the breakout above resistance at around 1760, then I start getting a bit more excited than I currently am. I’m encouraged but I’m not excited.
And interesting just looking at Cameco, the big uranium producer in Canada. It didn’t have quite as big an update as uranium itself. So, I’m also watching the stocks. But again, encouraging. It’s sitting above the moving averages. It’s in the middle of this big range though. So, for me, uranium is not in play as a current trade. It may be part of a larger position within a portfolio, but it’s not currently set up to do anything special at least in the near term. So, it’s still a space to watch.
So, hopefully, that’s been interesting. Let’s leave it there for this week. Thank you for joining me. I look forward to coming back and talking to you next week. Until then, bye for now.
Please see video for more detailed analysis and charts
Looking for the best ASX stocks to buy now?
Motion Trader‘s algorithms scan more than 2,000 ASX stocks daily in search of medium term investment trends. We then tell our members precisely when to buy shares. And most importantly, we tell them when to sell.
Try a no obligation FREE 14-day trial of Motion Trader, and see what an algorithmic trading approach could do for you.
Meet Jason

I'm Jason McIntosh, the creator of Motion Trader. My career began in 1991 on the trading floor at Bankers Trust. Nowadays, I trade my own systems from home in Sydney.
Motion Trader is for investors who value robust analysis, data driven entry and exit signals, commentary, and education. I use engineered algorithms to identify when to buy and sell ASX stocks. No biases or guesswork, just data driven signals.