ASX 200’s Failed Breakdown – Is It a Bullish Signal? | Episode 292
By Jason McIntosh | 8 August 2025
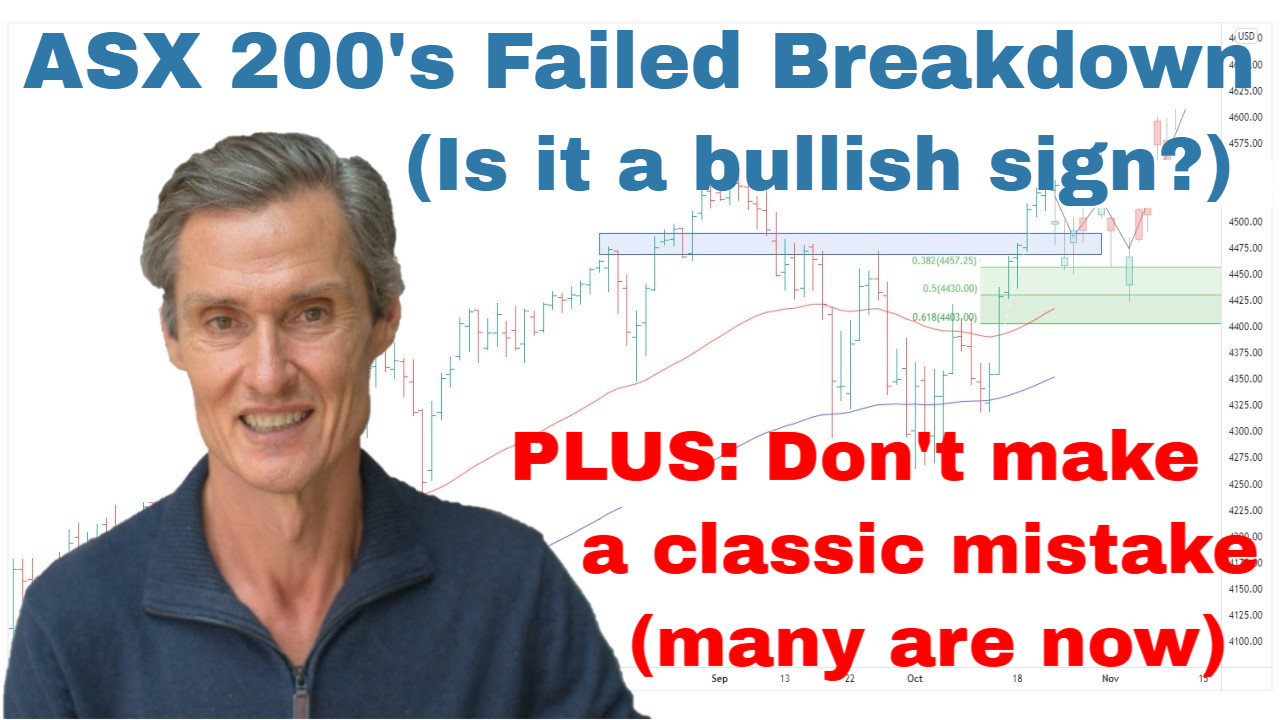
ASX 200: Bullish Breakout and Rare Win Over the US
It’s been an impressive week for the ASX 200, with the index breaking out to fresh all-time highs and outperforming the S&P 500.
Key developments:
- Last week, the index tested support around 8,630, briefly dipping below before closing right on the key level.
- That failed breakdown attempt was quickly followed by a sharp rally, lifting the index to new highs.
- Recent pullbacks have been shallow and short-lived, consistently met with buying interest.
- Price remains well above rising 50- and 100-day moving averages — the textbook definition of a bullish trend.
This price action suggests we’re still in a buy-the-dip environment, not a sell-the-rally one. News flow that might normally trigger selling has had muted impact, while positive developments have been met with strong buying.
From last Friday’s low, the ASX 200 has rallied as much as 3.3%, compared to 2.8% for the S&P 500 — a rare case of local outperformance.
Equal Weight ASX 200: Stronger Than the Main Index
The ASX 200 Equal Weight Index has been even stronger, rallying 3.8% from last week’s low.
Why this matters:
- The equal weight index is at all-time highs, outperforming the main ASX 200.
- The rally follows a shallow, short-lived pullback from the July peak — a sign of strong underlying demand.
- Broad participation from large caps often signals a healthier, more sustainable bull market.
The Importance of Broad Market Strength
Even more impressive has been the Small Ordinaries Index, which has outpaced both the equal weight index and the main ASX 200.
In healthy bull markets, strength often flows from the largest companies down through mid-caps and small caps. This broad participation increases the durability of the trend.
With price above rising moving averages, the structure remains bullish. Pullbacks in such an environment are often opportunities, not warnings.
S&P 500: Pausing Below July’s High
For the first time in several weeks, the S&P 500 did not set a new all-time high. Instead, it has consolidated just below the July peak.
Structurally, the trend remains bullish:
- Price is above rising 50- and 100-day moving averages.
- There’s a clear sequence of rising highs and rising lows.
- No signs yet of a major trend reversal.
Given the market’s 33% rally from the April low to the recent high in just four months, a period of sideways consolidation would be entirely normal.
Learn more about how moving averages work.
S&P 500 Equal Weight: Early Hints of Consolidation
The equal-weighted S&P 500 made a recovery high recently but has since pulled back to its 50-day moving average.
This suggests the broader market may be taking a breather, even as the main index holds near highs. Pullbacks to the 50-day average are common in strong trends and often provide a reset before the next leg higher.
Bottom Line: Trends Still Point Up
Across both markets, the primary trend remains bullish.
- ASX 200: Above rising moving averages with broad-based participation — stay with the trend.
- S&P 500: Consolidating after a strong run, but structure remains positive.
- Strategy: Continue to manage risk with trailing stops, and treat pullbacks as potential opportunities until proven otherwise.
Understand how to manage trades with trailing stops.
👉 For a deeper dive into technical analysis, check out our Weekly Strategy Sessions.
Motion Trader‘s algorithms scan more than 2,000 ASX stocks daily in search of medium term investment trends. We then tell our members precisely when to buy shares. And most importantly, we tell them when to sell.
Try a no obligation FREE 14-day trial of Motion Trader, and see what an algorithmic trading approach could do for you.
Take a Free 2 week Motion Trader trial
Video Timestamps
00:00 Intro
00:40 ASX 200: Big rally after a failed breakdown (this is the key message)
03:30 This is what many people are likely doing now
04:30 Look what this key index just did (it’s a big deal)
07:10 Here’s how I’m positioning my portfolio
09:00 SP500 stalls below record high (is it time to sell?)
10:10 Many people make this classic mistake – are you doing it now?
11:40 Why price action in the broader market matters
13:05 This is the play now (and my base case for stocks)
🎯 Exclusive Strategy Session Member Content:
[14:50] US small caps retreat to 50-day MA (what’s next?)
[17:30] Small Ords extraordinary performance – what it points to now
[19:20] And don’t overlook the Emerging Companies
[21:15] Big cross-currents in gold (which will be right?)
[33:00] Copper appears shell-shocked (but are copper stocks different?)
[34:30] Oil needs to do this to trigger a buy
[35:40] Uranium: North American stocks rally, local stocks fall (what to do now)
[39:00] Q&A with lots of stock ideas: Ethereum, QBE, HAR, CPU, AMP, MAH, SKS, SXE, MIN, FMG, PTM, ALK, IMR, EETH, MAQ, CSL, BCI, DDR, RMD, SIG, WC8, TPG, MFF, MTM

Jason McIntosh | Founder, Motion Trader
Jason’s professional trading career began over 3 decades ago. He’s a founder of two stock advisory firms, a listed funds management business, and has helped thousands of investors navigate the stock market. Click here to read Jason’s incredible story of, at age 20, sitting alongside some of the world’s greatest traders (and the life changing experience that came with that).
Meet Jason

I'm Jason McIntosh, the creator of Motion Trader. My career began in 1991 on the trading floor at Bankers Trust. Nowadays, I trade my own systems from home in Sydney.
Motion Trader is for investors who value robust analysis, data driven entry and exit signals, commentary, and education. I use engineered algorithms to identify when to buy and sell ASX stocks. No biases or guesswork, just data driven signals.