ASX 200 on Verge of a Breakout | Episode 140
Where is the Stock Market Heading?
00:00 Intro
00:30 Is this week’s ASX200 rally just the beginning?
02:47 This sector is still struggling.
04:12 Could this be a base for small caps?
05:18 I’m looking for opportunities like this
07:33 Was that a near term low in gold?
08:58 This is adding to the correction in Aussie gold
11:15 I really like what I’m seeing in uranium
Transcript
Please note: Charts available from video
This video is going to focus on the ASX 200. I’m also going to have a look at gold and uranium, so make sure you stick around for that. I’m going to cover the S&P 500 in a separate video (you can view that here). As always, this is general commentary. It doesn’t take your personal situation into account. With all of that said, let’s get into our first chart.
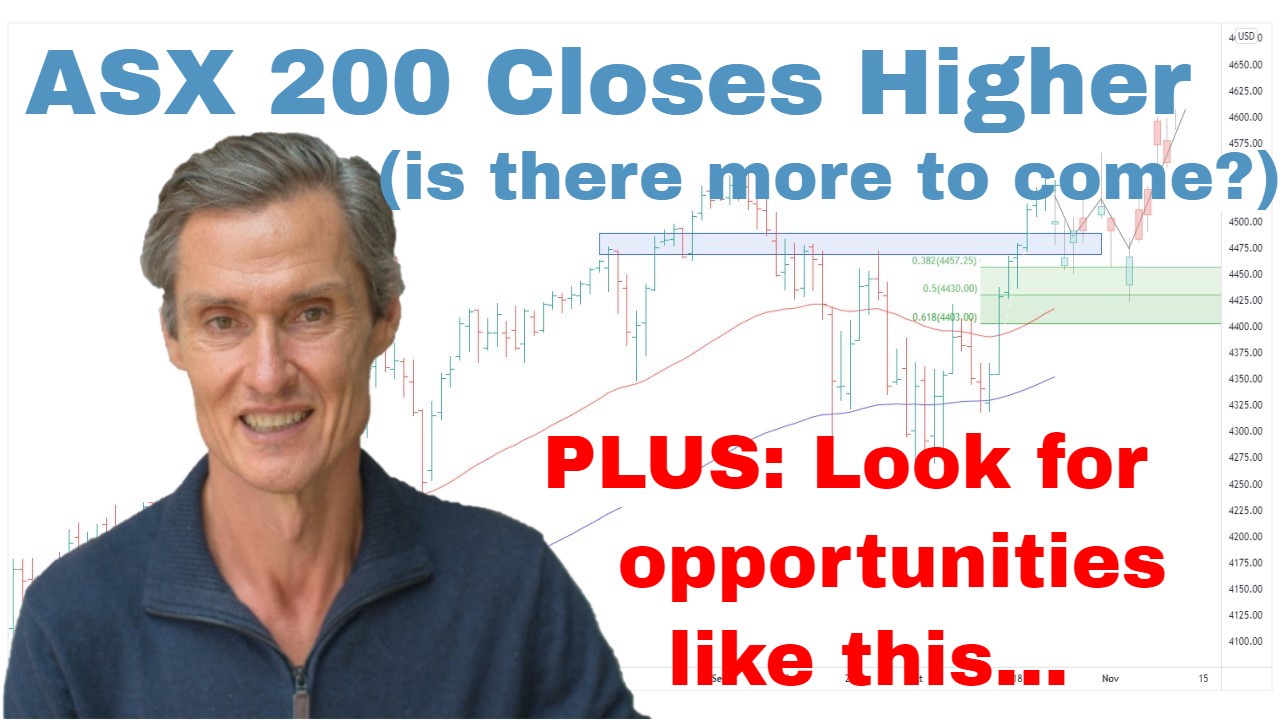
So, starting off with the ASX 200, and it’s been a positive week for the local market. And we’re getting quite a good close on Friday afternoon. Overall, though, it still does lack direction. We’re not in a trending phase of the market. There is a general lack of direction. And the positive part of this current situation I think is that the market is rebounding nicely off this Fibonacci retracement area.
So, I spoke about this last week. I’m using the March low and the April high. We can get this Fibonacci region. And we’re getting the bounce off it. So, that’s a very natural place, and it’s a good place to be seeing a rebound. And the key thing, though, is we need to see the price break this series of lower lows, which has been in place since the February high. And that’s one of the missing pieces for getting an upward trend. We need to see that sequence broken.
And it’s also noteworthy that the local market hasn’t been running with the U.S. market. So, we’re a little bit out of sync with the price action we’re often accustomed to. When the U.S. is running the ASX 200, we’ll often be moving in tandem. Moving averages, well, the market on Friday has just gotten above those moving averages, but the moving averages are really flat, the 50 and 100-day moving averages.
So, we’re really waiting for the price action to give us some sizes to where this index is going next. We want to see these upward moves. And we have seen some upward moves over the last several months, but we need to see them gain traction and follow through on the upside. So, this is going to be interesting next week to see whether we can punch above this trend line and start to break above some of these previous highs.
It’s quite possible this is a little flagging formation here, in that we’ve had the strong move-up. We’ve had the flagging consolidation. And we’re getting ready for the next leg higher, which will then test this overhead resistance, well, this big resistance, this triple top resistance at around 7,600. So, that’s a possibility, but we just don’t have that confirming price action to run with that at the moment.
And as I’ve been saying in the last couple of weeks, the banks remain one of the weights around the market. And this is NAB. And when you look at NAB, there’s no doubt this is a downward trend. We’ve got the 50 and the 100-day moving average, price is trending lower. We’re getting a bounce, but really it’s quite an anemic-looking bounce off the low at this stage. It’s nothing you’d be saying, “The turnaround is in place.” Westpac looks quite similar.
So, we really need to see some base form in these banks and start to see prices start to turn higher. That could take more than a couple of weeks to do that, to trace out some sort of a basing formation. So, that’s probably one of the biggest weak spots in the local markets at the moment. CBA’s interesting. We’ve been looking at this contracting range over the last couple of weeks.
And just today, we’re seeing the market testing up towards the upper end of this range. Still below the moving averages. But let’s see if…whichever way CBA breaks from this range, maybe that starts to give us some hints towards the next direction the overall market’s going to take. So, I think the banks are a key area to be monitoring for what the ASX is going to do next.
Jumping over and having a look at the small ordinaries. And, again, a positive day on Friday. Could this be a little bit of a basing formation we’re seeing develop that could see the market test higher? And this could be similar to the pattern that we’re seeing in the Russell 2000 in the U.S. When you compress this, maybe this is a large basing pattern, and we’re in the process of moving up towards the top of the range and then potentially beyond. I don’t know. I just don’t know at this point. I’ll be guided by the price action.
At the moment, we’re in the middle of a range. We’re sitting below moving averages, so we can’t get too excited about the local market at the moment. I think the local market remains very much stock-specific. And even still, that’s not easy because just over the course of the last six months, there’s been more false breaks than you get during an upward-trending phase in the market, simply because there’s so much whipsaw.
The market rises and then it falls again. And so that makes for tricky conditions. So, it’s about waiting for those right opportunities, and then managing your risk. So, I’ll give you an example of the opportunity which is still presenting in the local market despite this broad trading range that we’ve been in for months now. So, this is a stock called Mcmillan Shakespeare. I think they work around car leasing.
And what’s been interesting with this is this is a setup I love to watch for. See this here. We’ve got a tight consolidation. So, we had a trending phase, and then we had a tight consolidation and a real compression zone where the trading range is tightened up. And this week we had… And also it came back to the 50-day moving average. So, the price got away from the 50-day moving average and then came right back in. This is a setup that you can look for on the charts.
And this week, I think this was around Tuesday, I got a signal through my Motion Trader scans that I do each day, send them out to members, I got a signal when Mcmillan broke upwards. We had an upward break, and then I came and I had a look at the volume and I could see there was this big volume increase which accompanied the break. And that’s a good sign. That’s a sign of a lot of interest coming into the stock.
And its members had the opportunity to buy the next morning and has continued upward since. Pulled back a bit today, which is good. Some consolidation perhaps before maybe setting up for another leg. But no matter what it does next, whether you’re a swing trader and you’re looking for moves over maybe a few weeks or a couple of months or you’re looking for more medium-term trends like I’m looking for, these little patterns, the consolidations, the volume expansions, they’re the really interesting ones to look for, even in the current environment.
And now, in a moment, I’m going to get on and talk a little bit about gold and uranium. But first of all, if you’re getting some value, please hit that like button. Please leave a short comment, just, “Hey, thanks for the video.” It tells YouTube you’re watching, and then YouTube shows other people. Hit that subscribe button if you haven’t already, and visit me over at motiontrader.com.au and see if the work I’m doing around trend identification might be able to help with what you are doing with your portfolio.
All right. Over to gold. And not much different than last week. It’s been a week of just sideways trading. Just looking at the futures from last night, a little bit interesting in that the market traded lower, traded below the 100-day moving average, tried to break below the low from late May, and quickly traded back up. Maybe that’s a sign there’s some short-term base or near-term low in place and the market might try to rally again. But overall, it just doesn’t look like there’s a lot happening at the moment in gold.
So, it looks the same as last week. It looks like the exciting phase. The money-making phase might just be on hold for at least the time being. Having a look at Aussie gold, haven’t looked at that for a little while. We had a breakout back in March. The initial breakout that we spoke about was back in December when prices broke out of this little congestion zone. It came back to the moving averages, broke higher, got a good run out of that, and now we’re getting a pullback, moving averages look to be rolling over, price is below the moving averages.
So, again, just another sign that doesn’t look like gold is in a hurry to move to the upside. And just on Aussie gold, one of the reasons we’re getting a bigger pullback in Aussie gold than we are in U.S. dollar gold is because of the Aussie dollar. We’ve had quite a strong move in the Aussie dollar over the last few weeks. And part of that is interest rate-driven, but also just maybe a factor that the Aussie dollar has lost a lot of its downward momentum over maybe the last seven or so months.
This price action that we saw at the end of May was interesting because we had a situation where the Aussie was in a trading range. Let’s just quickly sketch something in. Trading within a range broke to the downside and stayed down there for a few days, and then quickly came back above it. I love that sort of pattern because that’s often a sign that the selling is exhausted and there’s a trend reversal in place, whether it be a larger, medium-term, or longer-term trend reversal, that’s yet to be seen.
But for the moment, it looks like the Aussie dollar has got a bit of strength returning to it. And just see where this goes. We’re above the moving averages. Moving averages are turning higher. You may remember when I’ve been talking about some of the index ETFs like the S&P 500 ETFs I’ve been trading or really investing in. I’ve been using a hedged ETF. And the reason for that is because…and I’ve said this at the time is that I’ve taken the view that if gold and commodities, in general, go through an upward phase maybe over the next year or so, that should be good for the Aussie dollar. So, I’d want my international exposures hedged.
So, I had someone tell me on the video last week that I should be explaining currency risk to people. But really, if you invest overseas, you’ve got to do some research. You shouldn’t be watching anyone’s YouTube channel and thinking that’s complete personal advice. I’m giving general ideas. I can’t cover every nuance of every investment. And that’s why I do talk about hedged ETFs. I did so in Japan a couple of weeks, so I think about a month ago as well.
So, all these interesting things come together to give us these ideas about where we could find opportunities in the markets. And just quickly jumping over to uranium. Now, that’s had a really good week. I really like what I’ve seen in uranium this week. We had the breakout a few weeks ago. We’ve had a pullback. And then this week we’ve had a rebound off the top of the upper boundary of this trading range, this smaller range within a larger range, which uranium’s been in. And we’re up here testing a 14-month high.
So, this is potentially part of a bigger upward move. I’ll give the benefit of the doubt to the upside in uranium until we see otherwise. Unless price pulls back and moves back within the middle of the range, I think we want to be playing uranium and uranium stocks from the upside. I like the commodity itself as an investment opportunity or a trading opportunity, whichever way you like to play it, but I’m also looking at the individual uranium stocks, and particularly like the ones in those safer jurisdictions, stocks like Cameco in Canada, maybe Boss Energy in Australia, and also the ETFs, which can give exposure to a diversified portfolio of uranium stocks.
And, of course, I’m being very stock-selective in stocks. In uptrends, I want to look for a lot of the uranium space. It’s currently not in uptrend, so I think it’s being quite selective about where we look for the opportunities. So, okay, well, let’s call that a wrap for this week. Hopefully, that’s been interesting. Hopefully, you get some ideas. Thank you for joining me. I look forward to coming back and talking to you next week. Till then, bye for now.
Please see video for more detailed analysis and charts
Looking for the best ASX stocks to buy now?
Motion Trader‘s algorithms scan more than 2,000 ASX stocks daily in search of medium term investment trends. We then tell our members precisely when to buy shares. And most importantly, we tell them when to sell.
Try a no obligation FREE 14-day trial of Motion Trader, and see what an algorithmic trading approach could do for you.
Meet Jason

I'm Jason McIntosh, the creator of Motion Trader. My career began in 1991 on the trading floor at Bankers Trust. Nowadays, I trade my own systems from home in Sydney.
Motion Trader is for investors who value robust analysis, data driven entry and exit signals, commentary, and education. I use engineered algorithms to identify when to buy and sell ASX stocks. No biases or guesswork, just data driven signals.