ASX 200: Is The Stock Market Rally Over? | Episode 132
Where is the Stock Market Heading?
00:00 Intro
00:20 Was the ASX200’s mid-week sell-off concerning?
02:20 This is what I think about the Small Ords
03:30 I didn’t anticipate this would happen (huge move)
05:28 Is gold starting a bigger correction?
08:20 This could be a problem for commodities?
09:40 Copper is looking vulnerable (watch this area)
10:44 Will uranium be the next big breakout?
Transcript
Please note: Charts available from video
This video is going to focus on the ASX 200. I’m also going to have a look at gold, copper, and uranium, so make sure you stick around for that. You can watch my video on the SP500 and Nasdaq here. As always, this is general commentary. It doesn’t take your personal situation into account. With all of that said, let’s get into our first chart.
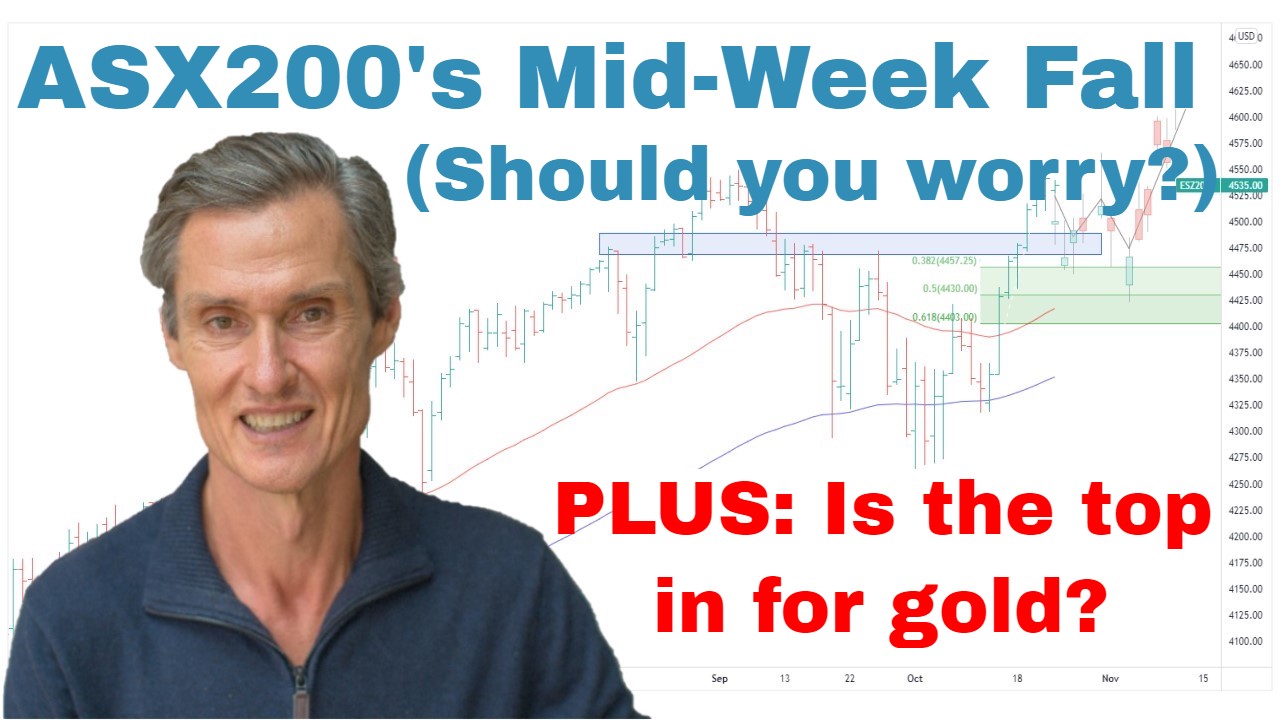
So, we’ve got the ASX 200 up on the screen. And it’s been a quiet week, but it’s been a generally positive week for the local market. There was a bit of selling. We saw a bit of selling on Thursday and Wednesday, and that was interesting because what happened, as the market sold off, there was good support. Good support came in. Buy the dip players came in and quickly pushed the market back up to where it started as decline. So, that was encouraging. That’s always a sign of a market which has some underpinning. And I think that buy the dip is one of those things you want to see in a market that is potentially going to move higher.
It’s also now back above these moving averages, the 50 and the 100-day moving averages. It’s been chopping either side of it over the last few weeks. So, we really want to see the ASX 200 start to move away from the moving averages. But at the moment, I think it’s generally constructive. I think the structure favors that we’ll see the ASX 200 continue to edge higher towards the top of this big trading range. So, this is a trading range, it’s been in going back 19 months or so. I think the current structure, also looking at what’s going on in the U.S., as I say, I think it favors a move up towards the top of the range, but we still don’t have a dominant trend in place. We remain in this range-bound market. And until we get a decisive break to the top side of this range, whenever that may be, I think conditions remain generally on the more difficult side with less consistent trends across the market generally.
Just having a look at the small ordinaries. Again, quiet consolidation. Just consolidating along the moving averages, the 50 and the 100-day moving averages. I think broadly positive. We had this strong rally from the March low and the price action over the last month, say the last five weeks has just been sideways consolidation. So, that’s generally the sign that the larger move is to the upside and then we’ve got a corrective move, which then opens up the possibility of another move higher. So, that’s the way I’d favor this playing out at this stage. I still think that the odds favor that maybe this is a large basing pattern which has been playing out since the June low, but it is all too early to say which way this is all going to go. I remain broadly positive to the market. Cautiously long is the way I’ve been describing it over the last several months, and that remains the case.
And just quickly, I want to touch on the Nikkei in the Japanese market. I mentioned this last week. I was talking about how the Nikkei was just starting to break out of this trading range which it had been in since going back to March last year. And I certainly wasn’t anticipating it was going to run 5.5% over the next week. But it just shows, it’s just amazing how quickly things can change when sentiment shifts. And for whatever reason it may be, there was a big sentiment shift last week in the Nikkei. So, things can go from… And this is the thing with trading ranges as well. Things can go from dull and difficult to it’s all happening very quickly. There’s no prediction for anything that’s happening at the moment elsewhere but it’s just a general statement on trading ranges. Just when you think it couldn’t get any more harder to make money, things change. And this is one of those examples.
I did mention a couple of ETFs last week with the Japanese market. If you happen to have a look at them and get some, that’s terrific. And I think that trend is up, momentum’s higher. I’d be hanging onto those plays. But in terms of getting set in them now, just looking how stretched this market is above the moving averages and how far it’s moved so quickly, I’d now be looking for some consolidation before thinking of getting in or adding to any position. But yeah, a really interesting market to keep an eye on, the Japanese Nikkei.
Now, if you’re getting some value from this, please hit that Like button. Please leave a short comment, just “Hey, thanks for the video.” Let YouTube know you’re watching and engaging, and then YouTube does what it does, and that helps me a lot. And visit me over at Motion Trader if you haven’t already done so. And leave your email address somewhere on the site and then I can send you the emails when I put these videos out each week.
And now let’s look at some commodities because they’ve had a interesting week as well. Let’s start with gold. So, we’re finally getting that notable pullback that I’ve been talking about the risk of happening over the last… It’s been since late March I think I started talking about gold was looking stretched and needed to do some work. It’s taken a while but now we’re getting a decent-sized pullback.
And you remember last week, I was talking about the divergence where we had the price rising. You can see gold making these new highs. Then it had an RSI where the RSI wasn’t making new highs, it was declining. This is how divergence can help. It can give you an idea of the possibility of a pullback, particularly when it coincides with overhead resistance as we’ve been talking about at around 2080. And my take in all this is I think gold is likely to be…my feeling is gold’s likely to be capped at around this 2080 level for a bit. Could be several months. We’ve just got to wait and see how the price action goes. But I think this is going to be a reasonable pause in the price action.
Just looking at it on the weekly chart. It has had this big move up from the October low. It would only be natural for it to do some consolidation and then maybe attempt to break higher later in the year. You never know the timing of these things, but big moves up usually require several months of some proportional consolidation. That said, if we get a break higher in the near term, well, I think you’d probably want to run with that. I think you respect the breakouts, but at this stage, looking at it, I think more consolidation and a little bit more time for gold to do some work.
Interesting having a look at a stock like Newmont. So, Newmont just taking over Newcrest Mining, the biggest gold stock in the world. Look at the price action though, it’s trading below moving averages and it’s got momentum to the downside. It’s not how I’d expect the biggest gold miner to be shaping up if all things were about to go for the gold sector and the gold price and everything was falling in the line. I’d expect this to be coiled up ready to break to the upside or already in an up trend or something along those lines. At the moment, it just looks like it’s not a stock that you’d even be watching closely because just nothing really happening. So, maybe be a bit patient with gold. It’s interesting medium, longer-term story, but maybe the timing is just not quite there for this big breakout which I think is so eagerly anticipated.
And looking at the U.S. Dollar. I think this is one of the reasons why gold may come under a little bit of pressure maybe at least over the next few weeks. We looked at this last week and I spoke about this support level that the Dollar was on and talked about the possibility that we could get some bounce off the support given it had been such a lengthy sell-off. And we are seeing that balance off support. How long it lasts, how far it goes, I don’t know, but the prospect remains that the Dollar could continue to see some strength.
Just quickly looking at it on a weekly basis where that support is which I drew last week. You can actually draw support going back quite a bit further around this level. So, this support goes back to 2015. So, you can see it’s had a number of times where it’s had an influence on the price. And this is where we are now. So, maybe this does open the possibility for the Dollar to rally over the next several weeks which then goes into that storyline that maybe the commodity sector generally maybe does pull back. So, one of those things to keep an eye on.
Copper is a similar story to gold in terms of the potential for weakness with the possibility of Dollar strength. Also, we’ve got these moving averages. They’re very much now crossing to the downside, the price is below the moving averages, consolidating sideways after a sharp decline. That’s not really a good sign. It’s a market which actually is vulnerable at the moment. Maybe it can base here and turn higher, but this is not a dip I want to buy. I’ll sit on the sidelines with copper and watch how this develops. If things are going to turn to the upside there’ll be a chance to buy. The price will start to move up, get back to the moving averages, consolidate, and start to rally again. Unless that happens though, I think the play with copper is to stand aside, see how this pullback develops over the next few weeks.
And just finishing up, just a quick look at uranium. Not a lot to add on last week, a week of consolidation, sitting above the moving averages. So, that’s all good. And we’ve got this coiling pattern. It continues to coil within this pattern. So, the overall structure remains interesting. I think it remains positive. There’s just nothing to do here at the moment. We’re just waiting for that breakout. It’ll come at some point. Just like we saw with that Nikkei chart, it can go from not a lot happening to quite a bit happening very quickly. Whether we get the same price breakout strength as the Nikkei, who knows? But it just goes to show these ranges do end and they can get very interesting when they do.
So, let’s leave that there for this week. Thank you for joining me. Hopefully, that’s been interesting. Hopefully, you’ve got a few ideas. And I will come back, and I’ll talk to you next week. I’m looking forward to it. Thanks for joining me. Until then, bye for now.
Please see video for more detailed analysis and charts
Looking for the best ASX stocks to buy now?
Motion Trader‘s algorithms scan more than 2,000 ASX stocks daily in search of medium term investment trends. We then tell our members precisely when to buy shares. And most importantly, we tell them when to sell.
Try a no obligation FREE 14-day trial of Motion Trader, and see what an algorithmic trading approach could do for you.
Meet Jason

I'm Jason McIntosh, the creator of Motion Trader. My career began in 1991 on the trading floor at Bankers Trust. Nowadays, I trade my own systems from home in Sydney.
Motion Trader is for investors who value robust analysis, data driven entry and exit signals, commentary, and education. I use engineered algorithms to identify when to buy and sell ASX stocks. No biases or guesswork, just data driven signals.