Trade the Trend | Episode 43
By Jason McIntosh | Published 3 June 2022
Trade the Trend is a weekly video focusing on where the stock market is going. It’s for investors and traders looking for insights to the market’s next move. Jason uses technical analysis of stocks and trend following techniques to help you piece together the world’s biggest puzzle.
Where is the Stock Market Going?
00:00 Intro
00:37 What are upside targets for the S&P500?
06:13 Is this a new bull market or a bear market rally?
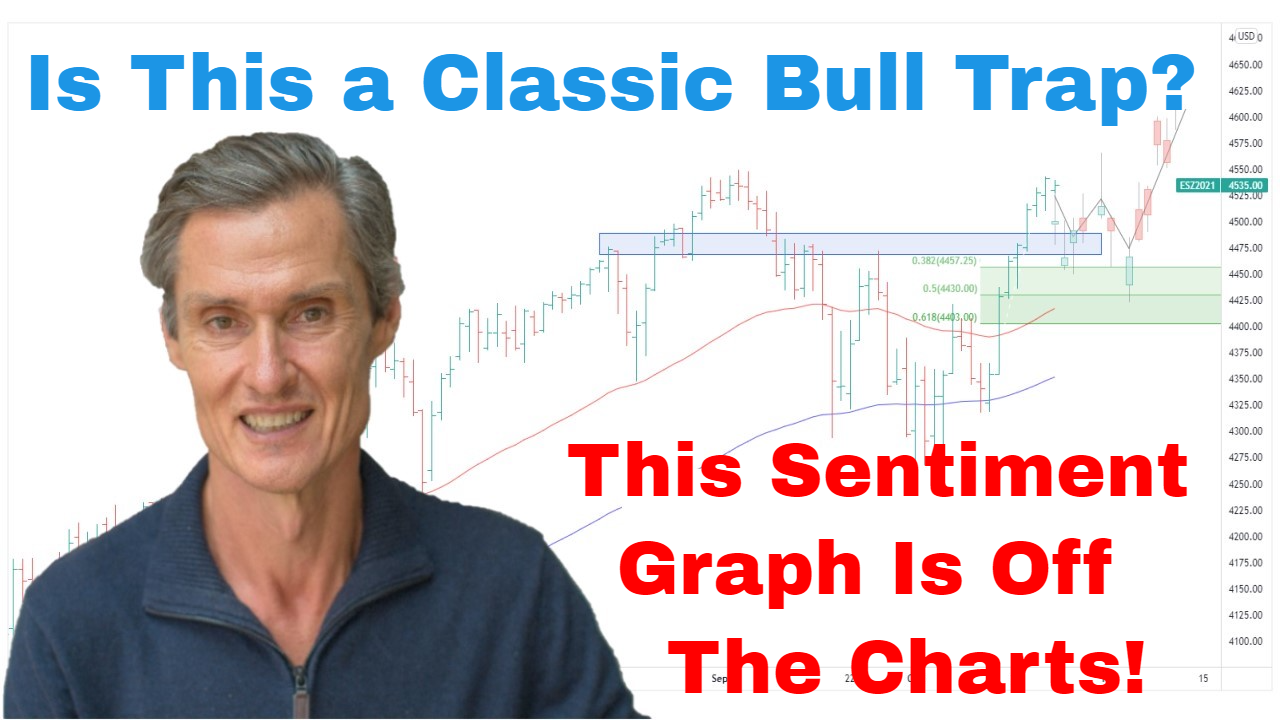
11:56 You have to see this market sentiment graph
15:32 How strong could a recovery be this year?
18:25 Where to find insights, strategy, and analysis of stocks
19:19 Is the ASX 200 about to stall?
23:40 What should investors do now?
Transcript (abridged)
Please note: Charts available from video
Welcome to this week’s edition of “Trade the Trend,” a weekly video discussing where the stock market is going. I’m Jason McIntosh. It is Friday, the 3rd of June, 2022. As always, this is a general commentary and doesn’t take your personal situation into account.
It’s been an interesting week in the S&P500. I’ve been talking for the last few weeks about the potential for a notable rebound. And while it’s been a little while coming, we’re finally starting to see it now. The theme over the last few weeks has that several indicators have been extreme oversold levels, and market sentiment reached overly bearish extremes. In the past, these conditions have led to market rebounds.
We’ve also got a classic zigzag pattern down from the year’s high. The market has also come back to a key Fibonacci retracement level and has completed a measured move from the March high.
I want to start by showing you a four-hourly chart of the S&P 500. It’s always interesting to look at finer detail on intra-day charts. Daily charts are great, but the hourlies provide details that are easily missed when using daily charts on their own.
Have a look at this:
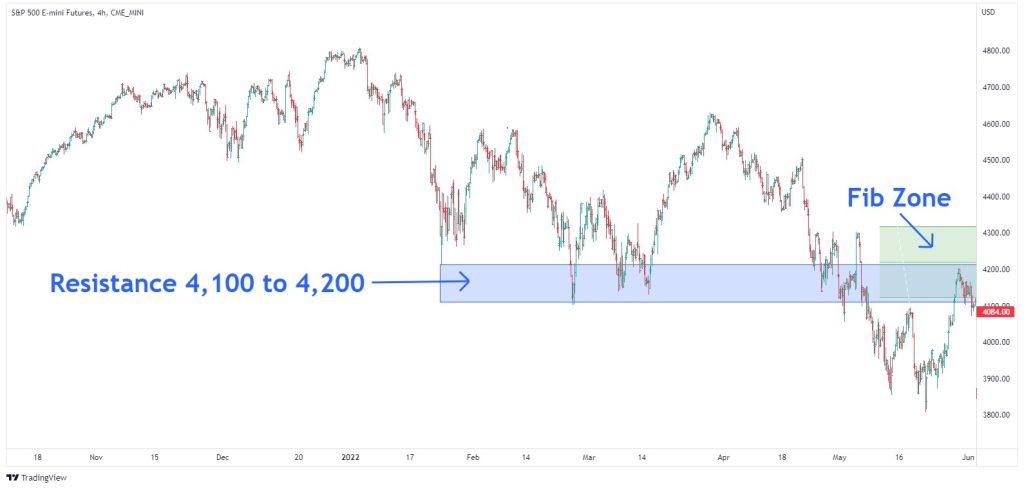
A key feature is a resistance band around 4,100 to 4,200. We can see the Fibonacci retracements from the March high to the recent low. The market has come right up into this resistance band. It’s also near the 50% Fibonacci retracement. And that’s where the market has stalled. I think the market might continue to pause here. I think what this has done, it has relieved an acute oversold condition that was present at the lows. It’s a case of what’s going to happen after the market settles down after the recent rally.
Once this pause finishes, I believe there’s potential for the S&P 500 to test higher, maybe get to the upper bound of that Fibonacci region, and possibly towards 4,400.
The big question is would that be the start of a new bull market, or would it merely be a bear market rally? My feeling is that it’s a bear market rally. Bear market rallies are commonplace within these larger declines, and they have a habit of drawing people in thinking it’s a real thing and then falling back upon themselves. I think that’s probably where we are at the moment. I think there’s a high chance that we will see lower levels later in the year. We can’t be sure of that by any stretch, but that’s the take I have on how this looks.
I feel the current sell-off isn’t a long enough corrective phase, and that it will take more time to work through. Bear markets really inflict pain. They’re all about inflicting the maximum pain on the most number of people, and they’re difficult. The fast recovery from the Covid low wasn’t typical of how bear markets work. They tend to be more grinding, and they go on and people just get over it and they leave the market.
While the recent correction has been uncomfortable, it hasn’t been drawn out at this stage. So, I think this is going to take more time to play out. This could go on for several more months. Bear markets tend to last around 9 months, maybe 9 to 12 months. So, at just five months in duration, the current bear market is quite short. One possibility is that the market zig and zags to a finial low in in maybe in September or October.
Corrections never play out exactly the same way. But there are particular types, and that is one type that does sometimes play out. From that standpoint, I’m still taking a cautious approach to this market. I’m not getting excited by this recent bout of strength. And I’m not getting excited about that being a time to get in there and start buying.
But that said, it’s always important to know that you could be wrong. It’s always good to consider other scenarios. And this is the thing with a good trader. A good trader is a flexible thinker, and good traders, don’t get locked into a viewpoint. They don’t let ego get in the way. I know markets don’t always do what I think they’re going to do, so I’m always aware of other scenarios.
Another possibility is that maybe that we have seen a final low. We’ve got a 20% decline in the S&P 500 and a 31% decline in the Nasdaq. These are significant declines, and they could by historic standards mark bear market lows.
I’ve seen some interesting analysis through the week which supports the possibility of a bear market low. Google searches for the term “bear market rally” are at extreme levels. This often occurs during the early stages of a recovery. People stay bearish for too long and continue waiting for new lows.
There are currently a lot of people talking about the prospect of a bear market rally. When everyone is saying one thing, I like to consider the other side. So, maybe from that standpoint, maybe this is the final low is in. It may not be a case of the S&P 500 racing back to new all-time highs, but maybe it’s a case of markets moving sideways for a period of time, and that the worst of the selling is over. So, got to keep an open mind to that.
The upshot from all that is that there’s a strong case for being cautious. But with that said, I know I could be wrong and so I am keeping some risk on the table. Just in the recent rally, I’ve tidied up some of my portfolios and sold some stocks which needed to go. I’ve also done a little bit of buying. So, I’m always open to that prospect that maybe the market will continue higher.
So many people they want to try and pick the low on the market, but there’s just so much risk with it. If you dollar-cost averaging into a long-term market ETF fund, well, that’s a different game. But if you’re trying to pick the low for a tactical trade or an individual stock, I think it’s just a risky thing to do. I’d rather miss the beginning of the next bull market, and I’d rather wait for the moving averages to turn higher, for the price to get above those moving averages. And if I do that, I typically lower the odds of getting chopped about in a messy market or in a down-trending market like we are in at the moment. And until we see the price get above these moving averages, I’m not going to be in a hurry to start loading up on stocks.
And remember, this whole investing game, it’s all about being patient. It’s about waiting for those asymmetric risk-reward setups. It’s about waiting for the odds to be in your favour and approaching the market on that perspective. The market is not in a hurry so we can’t be in a hurry. We’ve just got to wait. We got to wait for the setups. And the right setups, they will appear. They will come back and there will be great opportunities.
I don’t know when. Nobody knows when, but if we watch the data, we watch the price action and we protect our capital and we stay emotionally in the game, then we’ll be ready for better conditions. A key factor to coming out the other side is to not get worked up with all the gyrations in the market because you have too much risk, and you can’t sleep at night. We want to be ready to take the new opportunities when they invariably come. Let’s keep watching the market, watch the price action, and watch those moving averages.
Please see video for more detailed analysis and charts
Looking for the best ASX stocks to buy now?
Motion Trader‘s algorithms scan more than 2,000 ASX stocks daily in search of medium term investment trends. We then tell our members precisely when to buy shares. And most importantly, we tell them when to sell.
Try a no obligation FREE 14-day trial of Motion Trader, and see what an algorithmic trading approach could do for you.
Meet Jason

I'm Jason McIntosh, the creator of Motion Trader. My career began in 1991 on the trading floor at Bankers Trust. Nowadays, I trade my own systems from home in Sydney.
Motion Trader is for investors who value robust analysis, data driven entry and exit signals, commentary, and education. I use engineered algorithms to identify when to buy and sell ASX stocks. No biases or guesswork, just data driven signals.