Classic Setup Powers ASX 200 Higher — Can the Trend Continue? | Episode 293
By Jason McIntosh | 15 August 2025
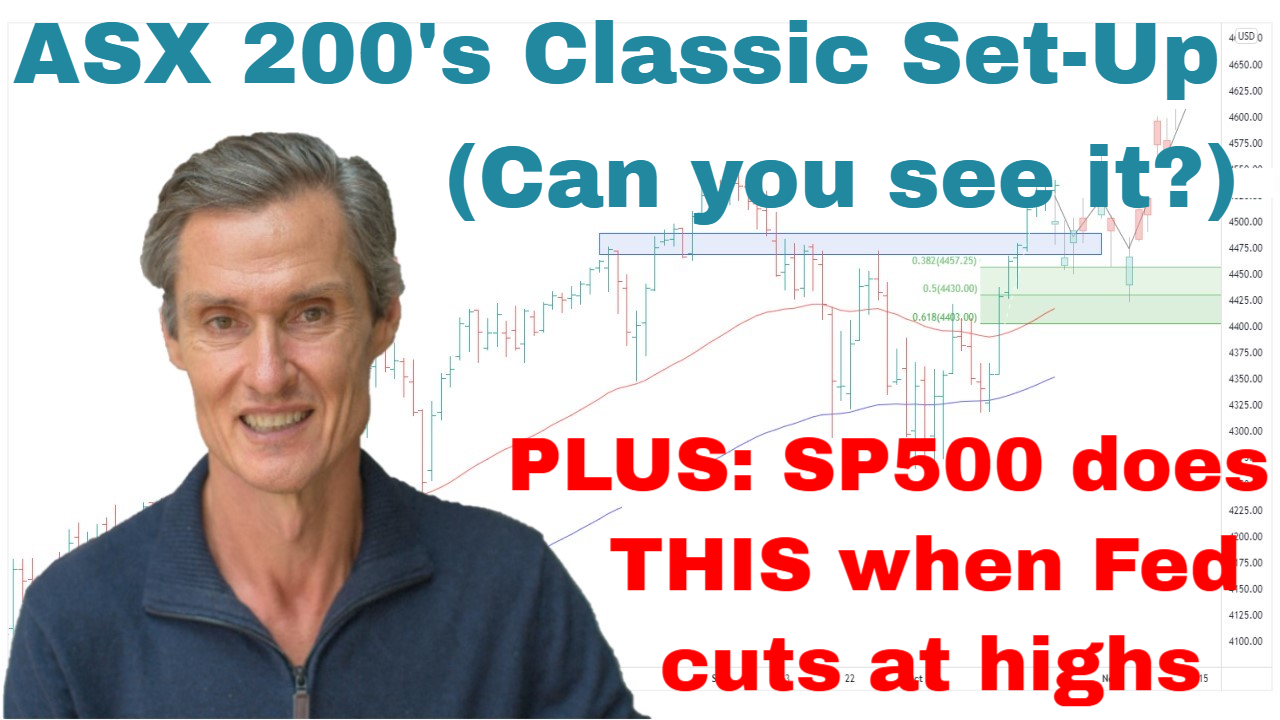
ASX 200: Textbook Bullish Breakout
The ASX 200 has continued its strong run, hitting a new all-time high on Thursday — and again on Friday as trading progressed.
This rally follows a classic breakout pattern:
- Sideways consolidation back towards the 50-day moving average.
- Price compression within a tight range.
- A breakout above resistance, followed by renewed upward momentum.
These setups are common across stocks, indices, and commodities — and when combined with rising moving averages, they often lead to sustainable rallies.
👉 Learn more about how moving averages guide trading decisions
Shallow consolidations have been especially important here. They show that investors are buying dips, keeping pullbacks short-lived and fuelling the next breakout.
“Rather than worrying about topping patterns, these compressions often set the stage for new highs.”
At this stage, the ASX 200 looks like a market that investors are still trying to get into. Those waiting for a 5–10% correction have been left behind as shallow dips continue to be met with strong demand.
Equal Weight ASX 200: Broad Participation
The ASX 200 Equal Weight Index has extended last week’s rally, up 4.9% since early August versus 3.1% for the main index.
Why it matters:
- The rally is broad-based, not just driven by a handful of large-cap names.
- Strong participation from across the market makes the uptrend more durable and sustainable.
- While the equal weight is more stretched above its 50-day average, any near-term consolidation would likely be a healthy pause within an ongoing bull market.
S&P 500: Fresh Highs Ahead of Fed Rate Cut
Over in the US, the S&P 500 and NASDAQ both made new all-time highs this week. Thursday’s peak marked the S&P’s 19th record high of the year, part of a cluster of highs since June.
The structure remains textbook bullish:
- A sequence of rising highs and rising lows.
- Prices above rising 50- and 100-day moving averages.
- Shallow, short-lived pullbacks followed by quick recoveries.
This pattern underlines the importance of staying with bullish trends, rather than waiting on the sidelines for the perfect entry.
Fed Rate Cuts: What History Shows
The Fed is widely expected to cut rates next month — and history suggests that could provide a tailwind for stocks.
Since 1980, there have been 22 instances where the Fed cut rates while the S&P 500 was at or near an all-time high. In every case, the market was higher 12 months later, with a median gain of 9.8%.
Of course, markets don’t rise in a straight line. Pullbacks often occur along the way, but the broader tendency has been for rate cuts near highs to reinforce the bullish backdrop.
S&P 500 Equal Weight: Back in Sync
The equal-weighted S&P 500 has rallied off its 50-day moving average this week, after a month of sideways consolidation.
Now within 1% of its November 2024 all-time high, it looks poised to potentially break through.
This is a constructive sign, showing that broad participation is catching up with the headline index — a hallmark of healthy markets.
Bottom Line
Both the ASX 200 and S&P 500 are displaying strong bullish structures:
- Breakouts above consolidation zones.
- Rising moving averages.
- Broad market participation.
With the Fed expected to cut rates soon, history suggests further upside potential in the months ahead.
Until there’s a clear reason to step aside, the strategy remains: stay with the trend, manage risk with trailing stops, and treat pullbacks as opportunities, not warnings.
👉 For a deeper dive into technical analysis, check out our Weekly Strategy Sessions.
Motion Trader‘s algorithms scan more than 2,000 ASX stocks daily in search of medium term investment trends. We then tell our members precisely when to buy shares. And most importantly, we tell them when to sell.
Try a no obligation FREE 14-day trial of Motion Trader, and see what an algorithmic trading approach could do for you.
Take a Free 2 week Motion Trader trial
Video Timestamps
00:00 Intro
00:40 ASX 200: Classic set-up leads to new highs (can you identify it?)
04:55 Shallow pullbacks suggest THIS is happening
05:50 Is the ASX 200 stretched above its 50-day moving average?
07:00 Why waiting for corrections can be risky
07:35 Don’t miss key message from the ASX Equal Weight Index
11:10 S&P500 hits 19th record high for the year (is a top near?)
13:20 This is the classic rule for rising trends
14:30 Since 1980, THIS happens when Fed cuts rates near record highs
17:20 Look what the S&P500 Equal Weight just signalled
🎯 Exclusive Strategy Session Member Content:
[20:45] US small caps do something surprising (are record highs coming?)
[24:15] Small Ords extend gains (#1 rule for rising tends)
[27:05] Emerging Companies standout performance – I won’t do THIS
[28:25] Gold compressing like a spring (be ready for something big)
[36:45] Should you follow copper price or the copper stocks?
[40:25] Oil slips below support – what it means for now
[42:15] Uranium needs to do THIS to trigger a buy
[46:50] Q&A with lots of stock ideas: MVP, FEX, MGX, OBL, TLG, ALK, BIO, WBT, DBI, PNI, SONY (JPN), CVX (US), GE (US), EBO, BRG, CNB, LVR, JHX, XRF, MP1, position sizing, DVL, VLS, BMN, ACDC, LTR

Jason McIntosh | Founder, Motion Trader
Jason’s professional trading career began over 3 decades ago. He’s a founder of two stock advisory firms, a listed funds management business, and has helped thousands of investors navigate the stock market. Click here to read Jason’s incredible story of, at age 20, sitting alongside some of the world’s greatest traders (and the life changing experience that came with that).
Meet Jason

I'm Jason McIntosh, the creator of Motion Trader. My career began in 1991 on the trading floor at Bankers Trust. Nowadays, I trade my own systems from home in Sydney.
Motion Trader is for investors who value robust analysis, data driven entry and exit signals, commentary, and education. I use engineered algorithms to identify when to buy and sell ASX stocks. No biases or guesswork, just data driven signals.