Be Careful Of SP500 Crash Predictions | Episode 119
Where is the Stock Market Heading?
00:00 Intro
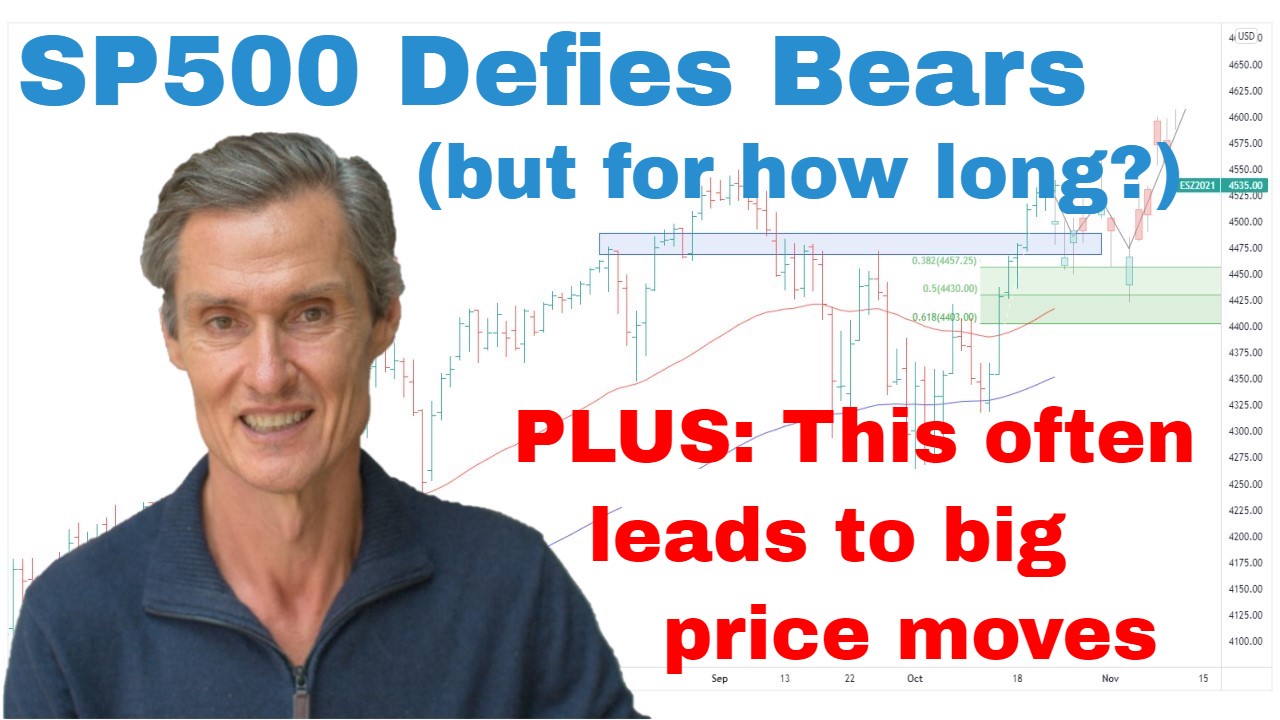
00:30 SP500 defies expectations (but watch for this)
04:00 Big and sustained moves often come from this pattern
06:30 Why you should pay attention to this ETF
08:18 Nasdaq does what many didn’t think possible
10:00 Can SP500 crash with this happening?
Transcript
Please note: Charts available from video
This video is going to focus on the S&P 500. I’m going to cover the ASX 200, as well as gold and uranium. In a separate video, you can view that analysis here. I’m also going to have a look at the NASDAQ and a few other U.S. Indices, so make sure you stick around for that. As always, this is general commentary. It doesn’t take your personal situation into account. All of that said, let’s get into our first chart.
So, I’ve got the S&P 500 up on the screen, and it’s been a really big week, but it’s also been an inconclusive week. So, of course, the big news that we had out during the week was the U.S. rate hike. And it’s really interesting when you think about what’s gone on in the last couple of weeks. So, we’ve had a rate hike. We’ve had a couple of banks collapse. We’ve had a large bank having to be absorbed into UBS. But I think if you knew this information in advance, you’d probably expect that the S&P 500 would currently be much lower, but it’s not, it’s still sitting above support. And if I put on some moving averages, you’ll see.
So, I put on the 15 to 100-day moving averages. You see it’s still sitting around those moving averages. So, it’s quite an interesting situation. I think there are currently a lot of cross-currents within this market as to how things are positioning. I’m going to go through some of them throughout this video. I think there’s a real lack of consistency in the price action, and this makes this situation we have at the moment in the S&P 500. I think it makes it particularly difficult to put all these pieces together, and trying to work out where we’re going.
Let’s start by just having a quick look at an hourly chart just to really get some detail on what’s been happening over the last couple of weeks. And as you can see on this, we’ve got this series of sharp declines. And this has continued through over into the current week. Just look at the number of sharp declines we’ve had. And on each of those declines, there’s been an almost equally sharp snapback rally. So, this is one of those times where both sides really seem to be losing money. Those who are bearish in the market, expecting a large selloff. They’re getting short on each breakdown, and a lot of them are getting stopped out on the ensuing rally. Same goes for the bulls. Those who are buying on the rally, a lot of them are getting stopped out on the decline. So, it’s a really seesawing, a really choppy market, and it’s a difficult market for most people to make money in.
Now, just going back to the daily chart, and what we have here. So, support is currently holding. This is around this 3,900 region. Being technically active going back many months, and that’s been holding over the last few weeks, despite repeated attempts get through it. That’s not to say that’s going to continue to hold, but so far that’s very much the case, and we’re sitting right on the moving averages at the moment. So, we don’t really have a great deal of insight from the averages in where this market is currently going. It really is somewhat directionless at the moment. I think this 3,800 level beneath support remains a key level, a breakdown below there. That’s where I think we could really start to see some follow-through selling. And that could set up a situation where the market does come back and retest this October low. But at the moment that’s not the case. We have a couple of layers of support, or we need to contemplate the possibility of a retest of the October low.
This is essentially a range-bound market, and range-bound markets can be really difficult to trade. And the reason range-bound markets are difficult to trade is that the price action is often quite erratic. And it just lacks that consistency that you find when the market’s trading within an upward trend. It just doesn’t have that same consistency. It’s more goes up, it comes back down and just continues that pattern. And it’s a difficult way to be buying stocks in that sort of environment. Now, one way to look at this range, and what I want to do, I’m just going to add some trend lines in, and just drew these earlier just to get the right shape on them. And I’m just going to put these trend lines on, and the different ways to look at this range.
So, one way is to look at this as a bit of a downward-sloping range. So, these are parallel lines. You can do parallel lines when… This fits quite well. This is one way to construct this range. Another way would be to look at a more of a rectangular type range. So, we could use the low point from June, use the recent high. We could even extend this back a few more months. And now, of course, there’s a couple of overshoots. There’s an overshoot in October. There’s an overshoot in August. But what I’m trying to do, I’m trying to compress this into the tightest range that I can. And really it’s been hanging in this range for around 10 to 11 months. So, that’s why now as this has continued to develop, we can now see why it’s been such a difficult trading period almost over the last year since we’ve been doing all this back and forth.
And now the thing is we don’t know how long this range is going to persist, and we don’t know which way it’s going to break from. But typically a break from a trading range, the size of the one we currently have, typically leads to a large move. It typically leads to also a long-lasting move, potentially a multi-month move, move which could run 6 to 12 months. We just don’t know when that’s going to occur. We’re in this holding pattern, and we are waiting, we’re looking for signs, we’re looking for clues to how it’s going to break. And what worries me a little bit with the way this is currently playing out is when I look at an S&P 500 equal-weighted ETF. So, of course, S&P 500 capitalized weighted, so the largest stocks have the most influence. Equal weighted. Everything is weighted the same.
When we look at this, it’s quite a different structure than what we see on the S&P 500. Quite a bit of technical damage has been done over the last couple of weeks with this sharp move-down we had with the bank breakdown, the regional banks in the U.S. being sold aggressively. This has really impacted the equal-weight S&P 500, and we’ve also got these moving averages are now crossing. We’re well below the moving averages. So, that doesn’t necessarily mean that this is going to continue to break down, but it does bring it right back into the middle of the range.
And again, you can see, just like in the S&P 500, let’s just draw in a range. This is this broad trading range that we’re currently in, and we’re now getting towards the lower end of the range. Middle to lower end of the range. A lot of technical damage. And at best I think it takes time for this to stabilize, and then start to ratchet higher. And because of that, this is why I think it’s hard to see a lot of upside in the S&P 500 just at the moment with the equal-weighted index just being weighed down so much. So, these are the cross-currents that I talk about with the market, and why it’s such a difficult situation to try and navigate and manage a portfolio.
Now, I’m going to look at the NASDAQ in a sec, but just first of all, if you’re getting some value, please hit that like button. Please leave a short comment. Let YouTube know that people are engaging with the video, which is so important for me because YouTube shows other people. And hit that subscribe button if you haven’t already done so. Now, let’s quickly just jump over the NASDAQ.
So, starting with the NASDAQ 100, it made a seven-month high last week. So, despite all the negativity, despite all the talk of recessions, and the market should be falling, the NASDAQ 100 has made a new high. It’s above the moving averages. Moving averages are trending higher. So again, when I talk about cross currents, this is another one. We can look at one industry and see, that doesn’t look so great, that’s looking negative. Then we look at something else, and you can clearly see a positive story to it.
So, cross-currents, which create a very mixed picture going across to the NASDAQ composite. And the NASDAQ composite is much more broader based than the NASDAQ 100, which is quite a narrow grouping of stocks. This doesn’t look as strong. So, for me, this is showing that the breadth within the market is worrying. It’s like the S&P equal weight. It’s like we have a handful of mega caps, which are largely underpinning the market. That said, I look at this, and it still looks encouraging because [inaudible 00:09:33] draw it there. I’m going to draw in a rounding basing pattern. If you just look at this, you can clearly see that that rounding base formation in place.
Now that’s an encouraging sign when you see that, also positive moving averages above the moving averages doesn’t guarantee it’s going to stay like that, but the moment that… It is supportive. Although it does look like those big caps are very much leading the way. Just quickly looking at Apple. Last week, Apple hit a, I think that’s a seven-month buy in Apple. So, whilst the bears like I saw a report this week, a very prominent investor calling for a 50% crash. That may happen at some point in the future in the months ahead even, but at the moment it just doesn’t look set up for the market to do that. It’s hard to see a broad-based crash when you have a stock like Apple hitting seven months high.
So, I think there’s no crystal ball here. Lots of reason to be concerned, but the price action isn’t following the bearish storyline present. For me, it’s very much a case of I think we need to be conservative [SP] with the way we approach this market. And I think we also need to have a decent weighting in cash. For me, I’ve got quite a high weighting in cash. This picture’s going to clear itself up. At the moment, it’s very mixed. Lot of cross currents. It will become clearer. As it becomes clearer, the positioning can become more assertive on the long side if we start getting those lows, long signals, or continue to pull back if the bearish case continues to, or evolves more than it already has. So, I think just play it safe, play it cool, be patient, and let’s ride through this period where things are far from certain. So, hopefully, that’s been helpful.
Thanks for joining me. Look forward to coming back and talking to you next week. Until then, bye for now.
Please see video for more detailed analysis and charts
Looking for the best ASX stocks to buy now?
Motion Trader‘s algorithms scan more than 2,000 ASX stocks daily in search of medium term investment trends. We then tell our members precisely when to buy shares. And most importantly, we tell them when to sell.
Try a no obligation FREE 14-day trial of Motion Trader, and see what an algorithmic trading approach could do for you.
Meet Jason

I'm Jason McIntosh, the creator of Motion Trader. My career began in 1991 on the trading floor at Bankers Trust. Nowadays, I trade my own systems from home in Sydney.
Motion Trader is for investors who value robust analysis, data driven entry and exit signals, commentary, and education. I use engineered algorithms to identify when to buy and sell ASX stocks. No biases or guesswork, just data driven signals.