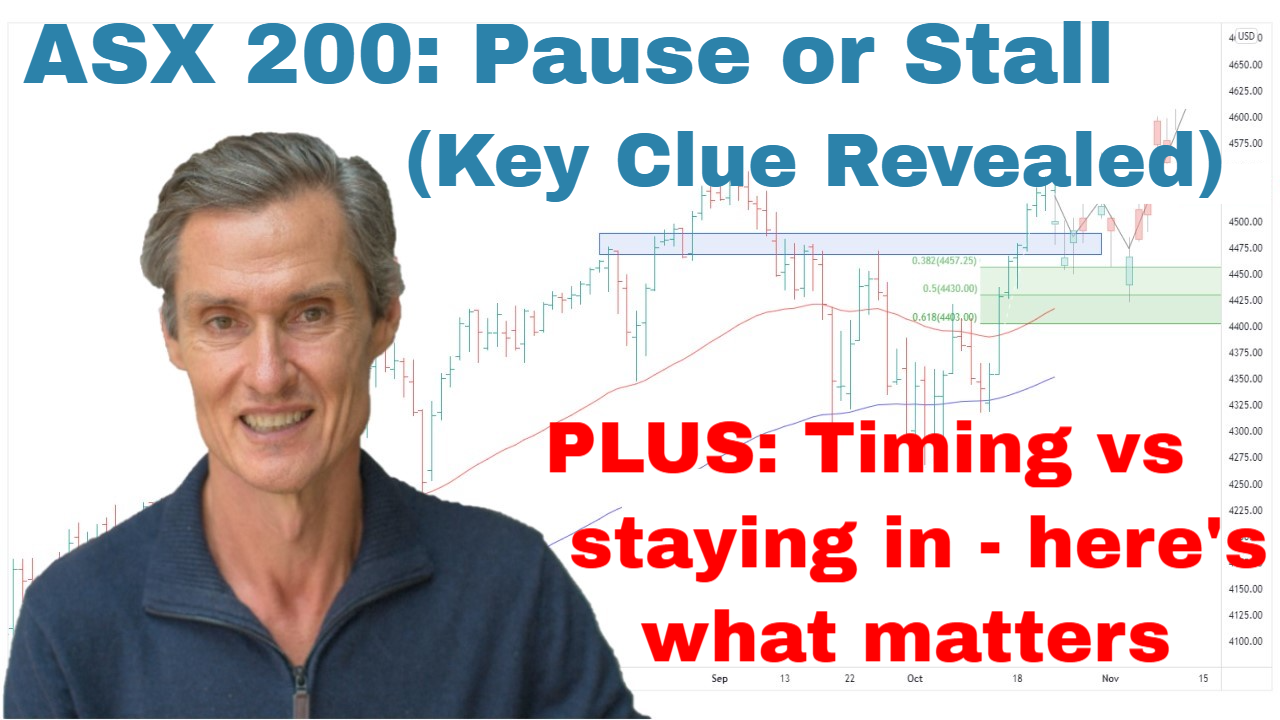
ASX 200: Is the Trend Changing? A Classic Signal Appears | Episode 290

By Jason McIntosh | 25 July 2025
ASX 200: Breakout Confirms Bullish Bias
The ASX 200 has broken out of a five-week consolidation, with steady price action confirming a bullish shift in sentiment. The pattern of higher lows during the consolidation was a clear sign that buyers were gradually increasing bids.
Key Observations:
- The breakout confirms the path of least resistance is higher.
- Price is trading above rising 50- and 100-day moving averages, a textbook sign of a healthy trend.
- Steady consolidation following the breakout is giving the market time to digest gains and potentially prepare for another move higher.
This is the kind of structure that builds confidence in the trend—not a guarantee, but a strong setup.
“Rather than worry about what might go wrong, the better approach is to stay with what’s working.”
Equal Weight ASX 200: Leading the Way
The real standout is the ASX 200 Equal Weight Index, which has outperformed the main index and surged to a new all-time high.
Why This Matters:
- A broad-based rally is more often sustainable than one driven by a few large-cap names.
- The equal weight index has jumped 4.4% in just over a week, compared to 3% for the ASX 200.
- Healthy bull markets are typically led by broad participation, not narrow leadership.
Even though prices are a little stretched above the 50-day moving average, some consolidation could be a good thing. It would allow the trend to reset before another push higher.
“Sustainable rallies typically have many pauses along the way.”
S&P 500: Bullish Structure Intact
The S&P 500 is hitting new all-time highs, notching its 13th high of the year last Thursday. From a structural point of view, everything appears to remain in good order.
Key Technicals:
- A strong sequence of rising highs and rising lows.
- Price remains above rising 50- and 100-day moving averages.
- No signs of extreme overextension in terms of time or distance from key moving averages.
To evaluate how stretched the market is:
- The S&P 500 has been above its 50-day average for 53 days — not extreme compared to prior bull runs.
- A distance-from-average indicator shows moderate elevation, but far from historic peaks.
In short: consolidation is possible, but there’s no major red flag to suggest an imminent reversal.
S&P 500 Equal Weight: A Healthy Confirmation
The equal-weighted S&P 500 also made a new recovery high, reinforcing the strength of the broader market.
Why That’s Important:
- It confirms this isn’t just about Nvidia or Microsoft.
- A wide range of stocks is participating, which often signals a durable trend.
“It’s the optimists who tend to make the most money in the stock market.”
Trend Following in Action
The takeaway across both markets is clear:
- Stay with the trend.
- Manage risk with trailing stops.
- Don’t try to time the top—let the market tell you when it’s time to act.
“The play here is staying long stocks, not looking for reasons to sell.”
This is trend following in action—identify the momentum, ride it, and let profits run while managing your downside.
👉 For a deeper dive into technical analysis, check out our Weekly Strategy Sessions.
Motion Trader‘s algorithms scan more than 2,000 ASX stocks daily in search of medium term investment trends. We then tell our members precisely when to buy shares. And most importantly, we tell them when to sell.
Try a no obligation FREE 14-day trial of Motion Trader, and see what an algorithmic trading approach could do for you.
Take a Free 2 week Motion Trader trial
Video Timestamps
00:00 Intro
00:40 ASX 200: Is the path of least resistance changing? (Buying pattern revels a clue)
02:15 Last week’s price action sets the stage for this
02:35 The key takeaway you should know now
04:30 Look what really caught my attention this week (it’s a big deal)
11:05 SP500’s textbook structure points to this….
12:05 But do these 2 “stress tests” suggest trouble?
15:40 What makes the most money: timing the market or staying in?
18:50 This is the play now (and a key lessons I’ve learnt during my career)
🎯 Exclusive Strategy Session Member Content:
[20:20] US small caps stall at resistance (is it a concern?)
[22:20] Small Ords outperform the big stocks (why you should pay attention)
[23:50] Don’t overlook this breakout in Emerging Companies
[25:50] Gold’s consolidation tightens further (which way will it break?)
[35:10] Copper hits a record high (this stock is still be a buy)
[39:30] This is my bias for the next move in oil
[41:00] I just bought this ETF (you probably don’t know it exists)
[43:10] Uranium at a critical stage – be ready for THIS
[46:00] Look which index ETF that I bought (the country may surprise you)
[50:05] Q&A with lots of stock ideas: CSL, WDS, RZI, HOOD (NAS), NGEX (TSX), RRL, BGA, ING, WGX, SXE, FWD, GNG, LTR, PLS, NXS, DRO, CUV, RXL, MIN, NIC, COH, NHC, NWH, WHC, A2M, ALK, EBR, OCC, C79, CYM

Jason McIntosh | Founder, Motion Trader
Jason’s professional trading career began over 3 decades ago. He’s a founder of two stock advisory firms, a listed funds management business, and has helped thousands of investors navigate the stock market. Click here to read Jason’s incredible story of, at age 20, sitting alongside some of the world’s greatest traders (and the life changing experience that came with that).

