Adacel Technologies’ (ASX:ADA)

By Jason McIntosh | Published 27 August 2021
Jason McIntosh explains why Adacel Technologies [ASX:ADA] could be an ASX stock to buy now. The company supplies air traffic management software and has strong cashflows. This interview appeared on Ausbiz financial news channel on 25 August, 2021.
Adacel won’t be familiar to most people. With a market cap of only $100 million, it typically doesn’t capture the headlines. It’s also just outside the All Ordinaries.
But if you’ve been following my articles, chances are you’ll know it.
I was on Ausbiz recently talking about the reporting season. One of the companies I discussed was Adacel, following the release of its full year result.
There’s also been a third buy signal from my Motion Trader service.
So with a few interesting developments, I’m revisiting the stock this week. You can refresh your memory on the company’s background here.
Okay, let’s start with the financials…
The company reported an impressive jump in profitability. Profit Before Tax (PBT) came in at $7.7 million — an increase of 248%. Revenue was up slightly to $40.1 million.
Another positive was that their gross margin increased from 35.2% to 40.1%. The company puts this down to a more profitable revenue mix and better project execution.
And this all leads to a strong balance sheet — net cash is up 124% to $11.6 million.
It’s going to be interesting to see how they deploy the cash. The three options they’re focusing on are dividends, a share buyback, and potential M&A activity.
Dividends for the year came to 6 cents per share, which equates to an unfranked yield of around 4.5%. This was 60% of their PBT, so they’re generating good cashflows.
I believe the ongoing share buyback helps underpin the shares. While merger and acquisition activity add further growth prospects over the next couple of years.
The charts also tell an interesting story.
Motion Trader doesn’t look for classic chart formations. It’s solely focused on using the price data to identify momentum (as it did in November, and then again in July).
But I know some people are interested in technical analysis. My early career was based around reading the charts, and I still enjoy the old school approach.
Let’s start with a bigger picture view.
Here’s the opening chart again:
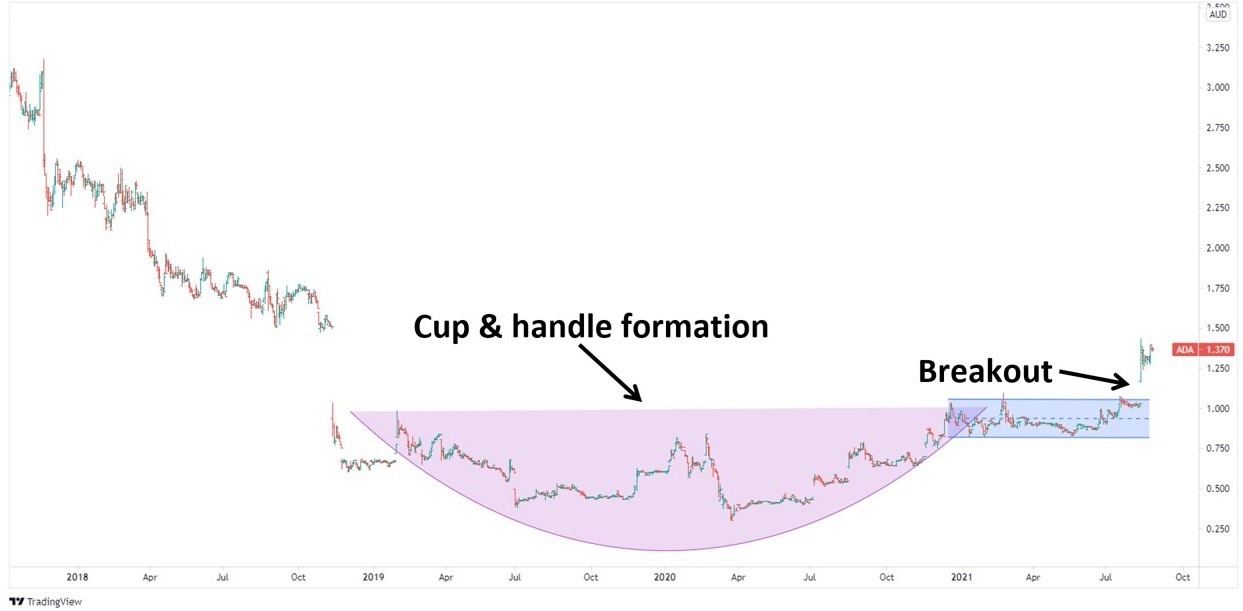
This is a classic chart formation — the cup and handle.
You’ll easily see why the pattern gets its name. It’s a variation of the rounding bottom formation that I studied early in my career. The difference is the addition of the handle.
The theory behind the pattern is simple: As the balance starts to shift from selling to buying, the share price gradually begins to turn upwards forming the cup.
The “handle” may form as prices retests old highs. This often attracts selling from investors who bought near those levels, and it can lead to a pause in the emerging trend.
A bullish signal occurs when prices break upwards from the handle.
Adacel’s chart has another feature that I want to show you.
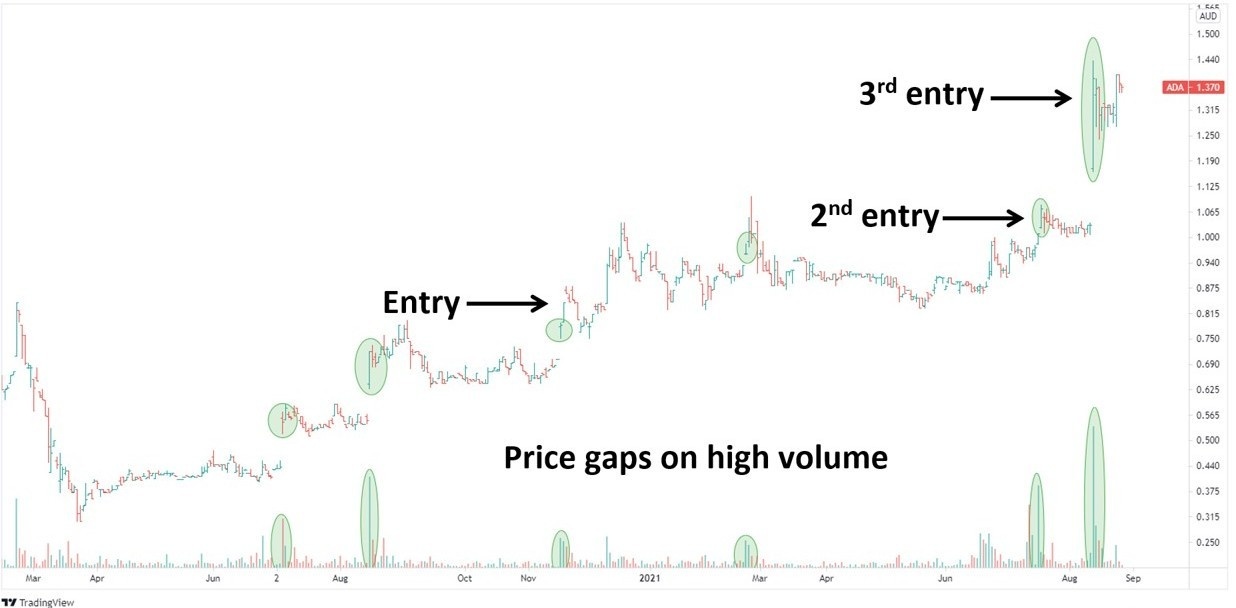
Have a look at this:
Many people avoid a stock if its price gaps higher. Their first thoughts are that it’s too late to buy, and that the upward spike is probably unsustainable.
But this often isn’t the case. In fact, a big price surge can be an opportunity.
Gil Morales and Chris Kacher detail a strategy called “buyable gap-ups” in their book: In the Trading Cockpit with O’Neil Disciples. They describe buyable gap-ups as the point that the bulls have decisively won the argument with the bears.
Rather than being a sign that an advance is almost done, the gap higher often results in a continuation of the uptrend — strength leads to more strength.
The key to the pattern is high volume. A valid signal requires the gap higher to be accompanied with an increase in volume of at least a 150% (on recent trading volume).
Have a look at the markings on the chart. The upper circles identify a series of price gaps, while the lower circles highlight the accompanying volume.
What do you notice about volume on the gaps?
It’s an easy answer: a big surge in volume.
Buyable gap-ups don’t guarantee a stock will continue higher. As with any entry set-up, many signals will inevitably fail. That’s we use strategies to manage risk.
That said, I believe it’s a useful technical indicator to know.
It’s possible the stock will need time to consolidate after the recent rally. But the big picture trend is positive. I believe Adacel has solid upside potential from current levels.
Where to invest now?
Looking for ASX stocks to buy now, as well as off the radar ideas most people don’t know? Our algorithms scan the market daily for medium term investment trends. We then tell our members precisely when to buy. And most importantly, we tell them when to sell.
If you’re ready to get started, try a no obligation 14-day trial of Motion Trader, and see what an algorithmic trading approach could do for you.
Meet Jason

I'm Jason McIntosh, the creator of Motion Trader. My career began in 1991 on the trading floor at Bankers Trust. Nowadays, I trade my own systems from home in Sydney.
Motion Trader is for investors who value robust analysis, data driven entry and exit signals, commentary, and education. I use engineered algorithms to identify when to buy and sell ASX stocks. No biases or guesswork, just data driven signals.