Will SP500s Historic Rally Unravel | Episode 85
Where is the Stock Market Heading?
00:00 Intro
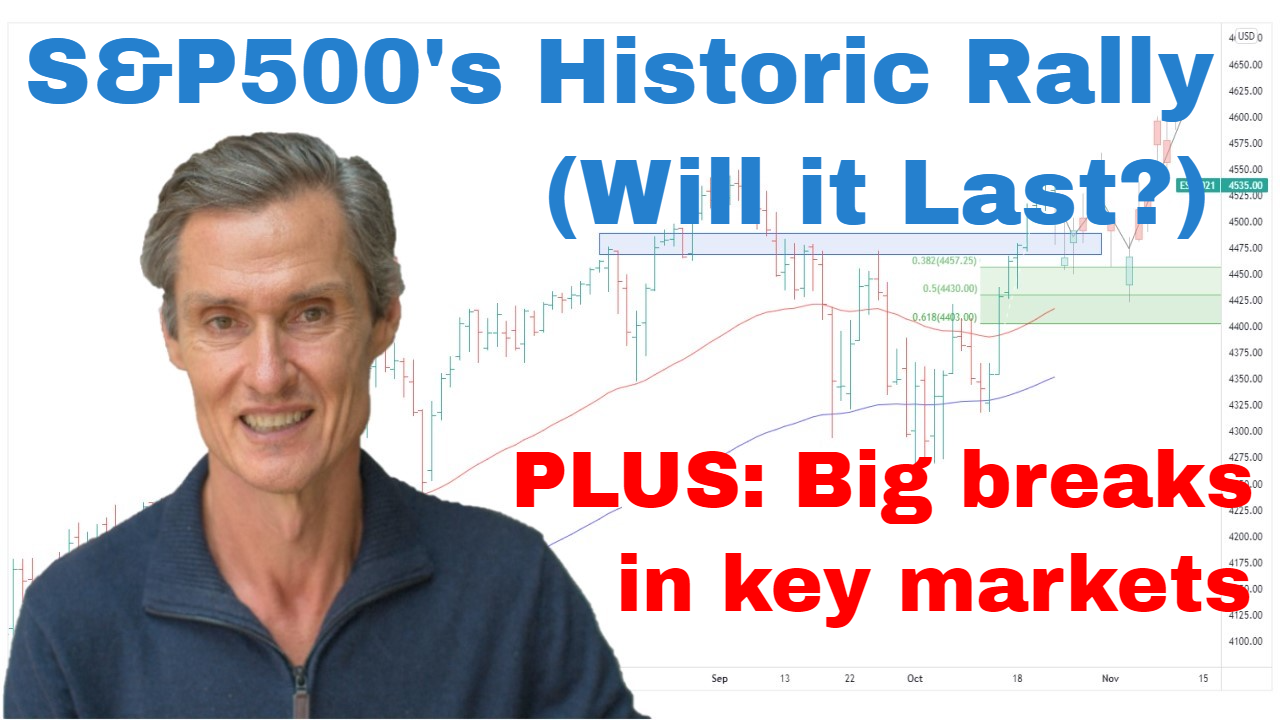
00:30 SP500 historic rise (look where it ranks!)
02:33 Remember this when assessing SP500 technical outlook
04:30 This is how the risk/reward shapes up now
06:08 Consider buying this index (better upside potential)
07:50 Pay close attention to this key indicator (it’s near an extreme)
09:33 Look what these two key markets are doing (and what they mean for stocks)
Transcript
Please note: Charts available from video
it really has been a fascinating few days for the S&P500. On Thursday, we had the CPI release, and the move we had to the upside, it happens to be the 15th biggest update since the 1950s. So, it really was an extraordinary move. And the catalyst of this historic update was, of course, the CPI coming in better than expected.
So, let’s go over to the four-hourly chart and start our analysis there. And what’s been interesting over the last couple of weeks is that the market really has just been consolidating in a sideways range beneath this resistance band around about that 3900 mark. So, we just compress this a little bit, and you can see the significance of this band how the market’s responded to it over the last few months. So, what often happens when a market trades sideways is that it builds up energy for its next move. And you can see by Thursday’s price action that it really did build up a lot of energy. And if you’ve been following these videos for a little while, you’ll know that I’ve been saying that the market just hasn’t seemed like it was set up for a crash. And I think the price action we’ve seen on Thursday how the market reacted to what was really a relatively…what was really only a mildly encouraging CPI number, the way it reacted with such strength, I think it really just shows how many people have been positioned for the worst. And when the worst doesn’t happen, it can often lead to a powerful move in the opposite direction. And that’s very much what we’ve seen over the last day.
Now, just going back to the daily chart. And I think the overall technical picture for the S&P 500 continues to improve. So, on the plus side, we’ve got the price starting to nudge above this resistance band around that 3900 mark. And we’re also now above the 50 and the 100-day moving averages, which is also a plus. So, I think we can say that over the last month, at least, the path of least resistance has been to the upside, and that very much remains the case. But I think it needs to be pointed out that if this were part of a large recovery, it’s still only very early days. The fact of the matter is we still have an established downtrend, and we can’t lose sight of that. Yes, there’s some encouraging signs, but this officially remains a bear market. So, I think there’s a need for treading carefully and not looking at one day and going, “Well, there’s a new trend in place.”
And I also want to point out that I’d actually be a little bit hesitant to add into my index exposure at current levels. And I think the time to have started easing into a position as we’ve been talking about over the last few weeks, it was after the last CPI where we got that failed breakout and the key reversal day. This was a point where I was saying in the videos that I thought it was worth having some exposure to the market, putting a toe in the water so to speak. And I’ve still got the position which I established down around here somewhere around mid-October I think it was because I’ve had no reason to exit. So, I’m still holding it and I’ll continue to do so. But in terms of adding to that position, I don’t like the risk-reward perspective so much right here and now. Look where the market currently is positioned. It’s only about 3.5% to 4% below this down trendline. So, that potentially limits upside at least in the near term.
Then I look over at the Dow which is an interesting one which we spoke about last week. When I look at the Dow, it’s rallied close to 16%, maybe 17% over the last 6 weeks. So, that’s a big run in a relatively short space of time. So, I don’t think entering up here is an asymmetric entry point. I think that the near-term pullback risk is greater than the near-term upside potential. And just looking at these Fibonaccis I’ve put on. Just put on the Fibonaccis of that last rally. If the market were to pull back from these levels, this is the band I’d be looking at for a potential pullback and also looking at where the moving averages are. When you get a market that goes from the lowest moving averages and it flips to being above it’s moving averages, you’ll often get a return move and a retest to those averages before trend reengages and continues upwards if that’s, in fact, what it does. So, I think there are some reasons to be cautious adding index exposure up here at least in indexes like the Dow and the S&P.
I’ll quickly show you an area of interest in the market which I would consider putting on exposure now. And it’s in the small caps. Been looking at the Russell. Russell’s really been performing in an interesting way. Risk-reward looks better. So, it’s just bounced off support. So, we’ve had this move up from the October low, got through this little resistance band, fall back to resistance, and now it’s rebounding off it. So, I think the recovery potential in the near term is possibly greater in something like the Russell. And I think the risk is quite well-defined because you could have a stop loss just below these lows just from last week. So, it’s a relatively close stop loss, upside potential. You look at this resistance band around 2100 odd. So, it’s more upside than downside. If I was going to add to my market exposure through U.S. indices, the Russell is the one which I would be looking at at the moment.
Now, if you’re getting some value from this, please hit that like button, and please leave a short comment, just “Hey, thanks for the video.” It just tells YouTube that people are watching, people are engaging. When people do that, YouTube shows more people. And that’s why I make these videos so I can get my message out there, talk about the possibilities, help people understand what could be happening. And if you can do that for me, it’d be amazing. Thank you. And also, please hit that subscribe button if you haven’t already done so. I’d love to have you as a subscriber to my YouTube channel.
So, let me show you another reason why I’m a little bit hesitant to adding exposure to the big caps like the S&P and the Dow. So, I’m looking at this. I’m looking at the number of stocks which are trading above their 20-day moving average. So, it’s interesting when you look at this. We’re now at an elevated point. We’re up around this 90% mark. And when the number of stocks above their 20-day moving averages gets around 90%, hence be a point where the market pauses and pulls back. Sometimes it leads to large pullbacks. This is not what I’m looking for at the moment. Other times it leads to pauses and consolidations. So, take this point, for instance. This was more of a pause and a consolidation. Maybe we’re heading towards something like that, but it just does mean there is I think the…adding up here so close to a trendline when you have this many stocks above their 20-day moving average just a little bit hesitant, and I’d think twice before adding to exposure. But that said, I’m not looking at pulling exposure off. I think if you got exposure, I’d be keeping it. I’m keeping my exposure.
And I’m going to just quickly show you two more positive developments which makes me think that maybe there is. When I look at the S&P and I look at the Dow, I think there really is a potential that this is… There could be a larger basing pattern in the makings but saying that that could still take several months to play out. The market is backing and filling moving sideways. Large bottoming processes take time. They don’t happen in one day. So, looking at a couple of other positive developments.
Going over to the bond market. So, this is a U.S. 10-year bond yield. I spoke about this a couple of weeks ago. Spoke about some divergence that was playing out on the weekly chart and talked about the potential maybe we were reaching at least some sort of an interim high. So far that’s playing out. We had a strong move lowering yield on Thursday after the CPI. Just throwing on some Fibonacci retracements of that last up leg just gives you some idea of what could happen should the bond yield continue to retrace. Potentially start getting levels back towards the mid-threes. Now that would be positive for the stock market I would think because a lot of the stock market volatility this year has coincided with the increase in yields. So, if we see yields start to fall back, maybe that’s going to be a tail win for equities. Maybe that helps equities form a more substantial base. We need to keep an eye on this, keep seeing how this plays out.
Also going over and looking at the U.S. Dollar Index which is another interesting part of this broader puzzle. Been keeping a close eye on this flagging pattern over the last few weeks. The risk with the… A flagging pattern will often turn and break to the upside. This one hasn’t done so. The momentum stalled, and we did get the hint that this momentum could have been stalling over the last week or two. Now we’re broken to the downside below this lower trendline. So, I think that suggests to me that we now have an interim top in place in the U.S. dollar. Price is now below the 100-day moving average. So, I think there’s potential for the dollar to continue pulling back on yields to continue pulling back. So, I think that is positive for the stock market.
All that said, I don’t think that this is an all-in go-in-and-buy moment. I think it’s a case of holding what you have. I think we want to see how this momentum continues to play out, but there’s still a number of scenarios that could play out over the next 12 months and they aren’t all this market’s going off to a new high bullish. But I think for the moment, that’s where the broader momentum is. Maybe over the next couple of months, we look for some sort of a pause, but then we maybe look for a retest of this trendline. Let’s see how it plays out. Some really interesting things happening, but it’s all a case of continuing to monitor that price action on a really regular basis.
Please see video for more details analysis and charts
Looking for the best ASX stocks to buy now?
Motion Trader‘s algorithms scan more than 2,000 ASX stocks daily in search of medium term investment trends. We then tell our members precisely when to buy shares. And most importantly, we tell them when to sell.
Try a no obligation FREE 14-day trial of Motion Trader, and see what an algorithmic trading approach could do for you.
Meet Jason

I'm Jason McIntosh, the creator of Motion Trader. My career began in 1991 on the trading floor at Bankers Trust. Nowadays, I trade my own systems from home in Sydney.
Motion Trader is for investors who value robust analysis, data driven entry and exit signals, commentary, and education. I use engineered algorithms to identify when to buy and sell ASX stocks. No biases or guesswork, just data driven signals.