Trade the Trend | Episode 46
By Jason McIntosh | Published 24 June 2022
Trade the Trend is a weekly video focusing on where the stock market is going. It’s for investors and traders looking for insights to the market’s next move. Jason uses technical analysis of stocks and trend following techniques to help you piece together the world’s biggest puzzle.
Where is the Stock Market Going?
00:00 Intro
01:03 SP 500 performance by year (this year is worse than you think)
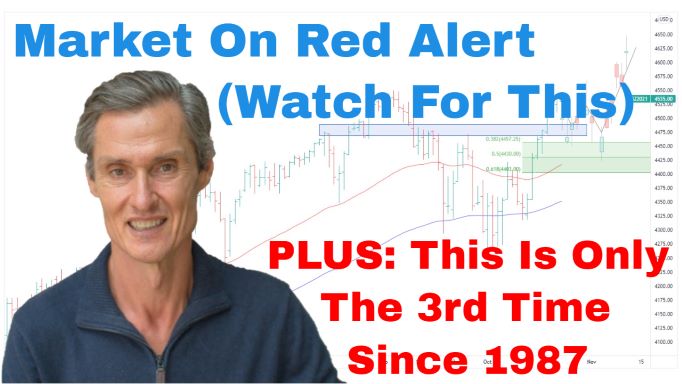
02:48 Why the SP 500 remains on high alert
04:44 This major stock market is crashing (SP500 may be next)
06:04 A capitulation sell-off is likely if the SP500 does this
07:19 Why I’ve been playing defence since late January
08:58 This price action will signal the end of the SP500’s sell cycle
11:57 Don’t overlook this big potential positive for the SP500
15:54 Where to learn about trend following and get algorithmic buy and sell signals
16:50 This indicator has been calling key turning points (what does it say now)
Transcript (abridged)
Please note: Charts available from video
Welcome to this week’s edition of “Trade the Trend,” a weekly video discussing where the stock market is going. I’m Jason McIntosh. It is Friday, the 24th of June, 2022.
Let’s start by looking at where the S&P 500 is heading. With the current price just above their lows for the week, I the S&P 500 remains on high alert. And this applies to the US equity markets generally.
I’m going to come back to the S&P 500 in a moment. But first, I want to show you a graph turned up on my Twitter feed through the week.
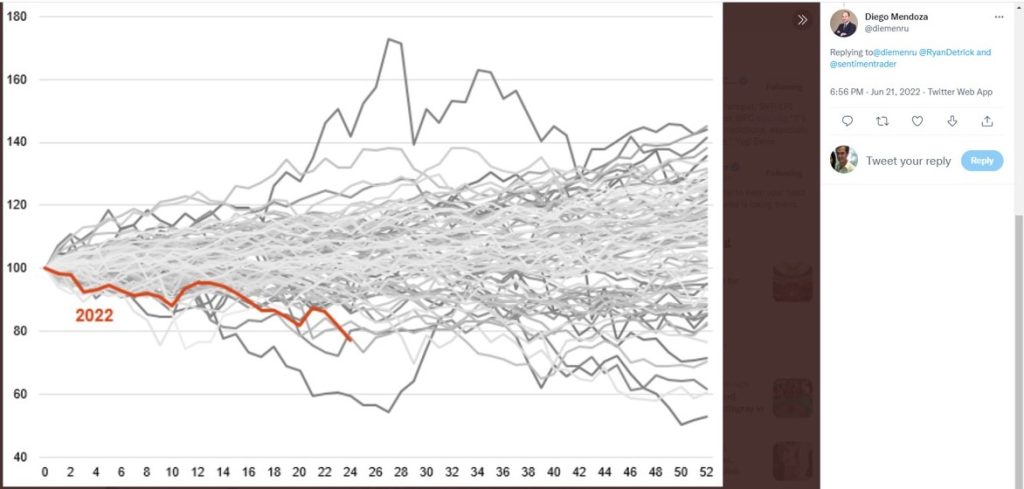
This graph plots the yearly performance of the U.S. market going back to 1928. Each of the lines represents one year’s performance in the U.S. stock market. And the red line is where we are in 2022. As you can see, it is one of the worst years in history. The only worse period is 1932, which was during the depths of the Great Depression.
There are two other years with similar downside. They were back in 1962 and 1940. But really, the current bear market in the S&P 500 is of historic proportions. And I think looking at a graph like this puts some perspective around what’s been going on. If your portfolio has been hurting, and you’ve found this a difficult period, well, it’s a good reason.
This is also evident in the statistics. From the March high, the S&P 500 fell 10 out of 11 weeks. And I believe that’s the first time that’s happened since 1970. This has been one of the nastiest selloffs in decades.
As I said, I believe we need to remain on high alert for US equities. What worries me with the U.S. market is this cascading pattern on the charts:
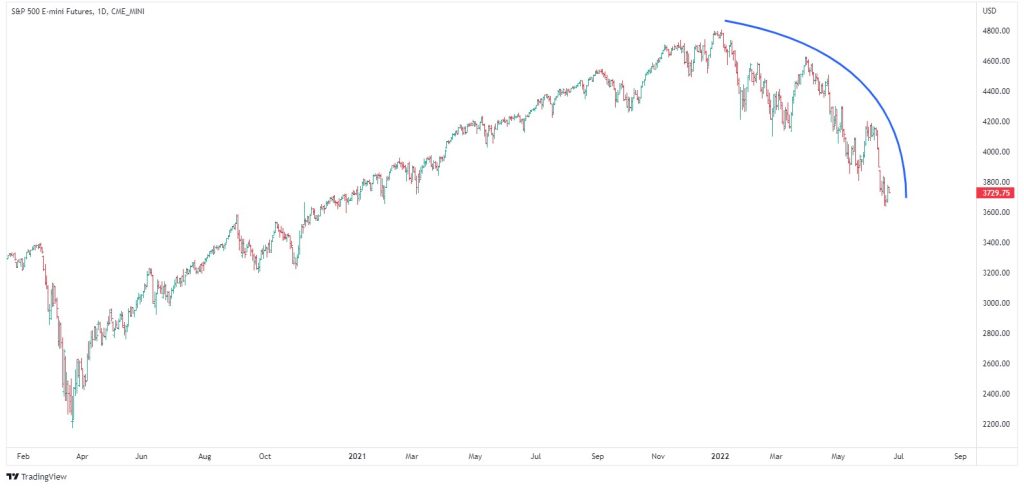
I spoke about this last week. The rallies have become shorter, and the selloffs have become steeper. That creates a cascading pattern. The same technical set-up is evident in the Nasdaq and Russell 2000.
Whilst these indices are below their 50 and 100-day moving averages, I think they remain vulnerable to a capitulation-style selloff. That could potentially see a rapid decline in the S&P 500 down towards 3,200.
Here’s an example of a market that is unravelling even more than in the U.S:
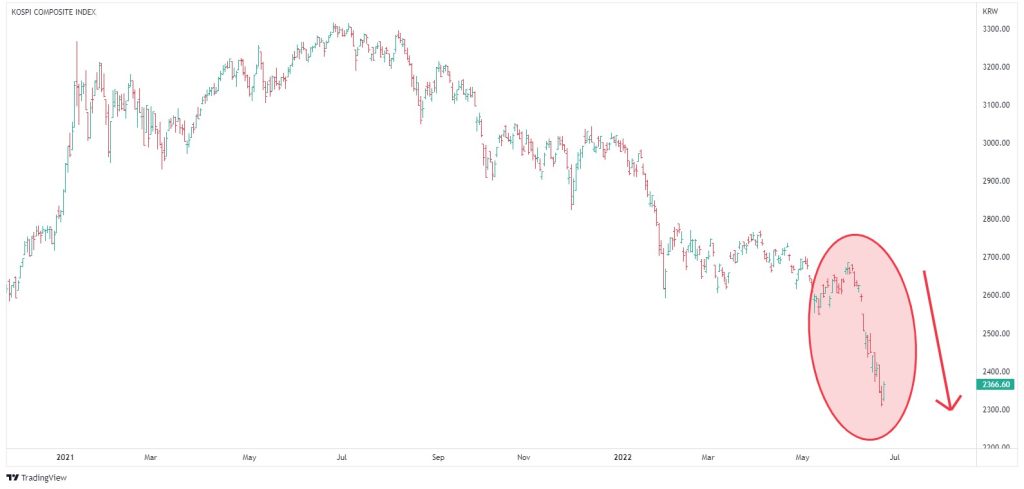
This is the South Korean market. It’s an example of the cascading-type motion that I’ve been referring to. This market peaked earlier than the U.S. market peaked in July 2021. And in the last couple of weeks, we’ve seen the South Korean KOSPI roll over into that capitulation-style sell.
A similar selloff in the S&P 500 would likely drag down global markets. I’d expect a flow-on effect into the European markets, into the Australian market, the Canadian market, all the developed markets that would likely see a significant sell cycle. That’s the risk markets are currently facing.
I’ve been saying the game shifted to defense since in January when the Nasdaq broke down out of a big trend channel. That was the warning sign that we wanted to go on defense. And if you’ve been watching my weekly Trade the Trend videos, you’ll know that’s been the ongoing theme for many months.
One of my core messages has been to avoid buying the dip… don’t buy dips in stocks that are trading below their moving averages, because they’re the most vulnerable. And that’s where we’ve seen the biggest losses during this stock market correction.
Another message has been to sell stocks that are trending lower. That what I do for members of my Motion Trader service. I calculate trailing stop losses so members know exactly when to sell a falling stock, rather than holding and hoping for a recovery.
Having a disciplined exit strategy can help avoid many of the loss which have been occurring through this period. And I think that’s the best way to mitigate the risk of a further deterioration in this market.
So how can this market turn around?
Let’s jump over to a four-hourly chart. This provides the finer detail as to what’s going on. The section I’m going to focus in on is the last leg of the decline.
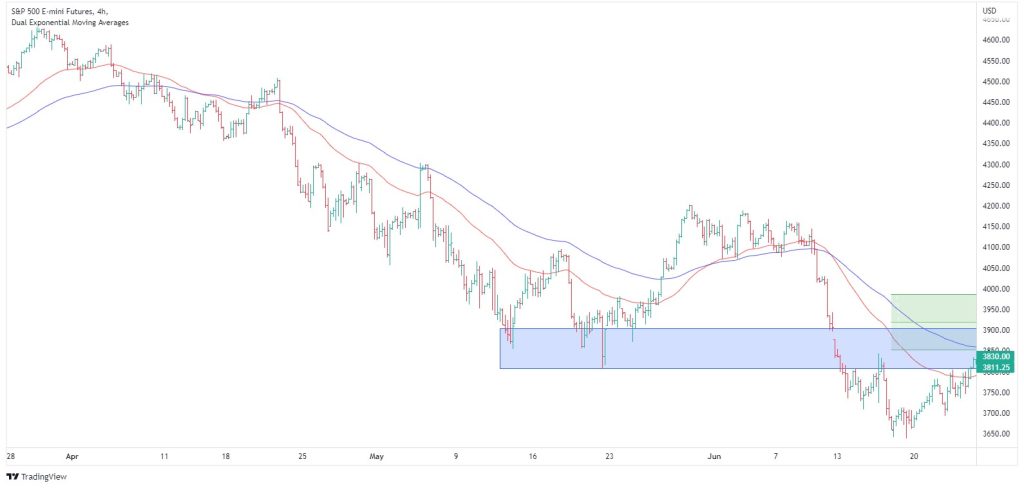
I’ve put the Fibonacci retracement levels on the chart. They come in between around 3,850 and 3,980. There’s also a resistance band that comes in at around 3,800 to 3,900. This captures a series of previous lows. So the S&P 500 has a double resistance area.
The first hurdle for the S&P 500 is to clear these resistance points. If it can do that, then I’d expect to see short covering gather momentum. And that’s what could propel the market back up towards the previous high around 4,200 and break the immediate sell cycle that’s currently in play.
A break above resistance would take the market off red alert. But it wouldn’t necessarily mean that the final low is in place. With the S&P 500 at a critical juncture, we’ll need to monitor price action closely.
Please see video for more detailed analysis and charts
Looking for the best ASX stocks to buy now?
Motion Trader‘s algorithms scan more than 2,000 ASX stocks daily in search of medium term investment trends. We then tell our members precisely when to buy shares. And most importantly, we tell them when to sell.
Try a no obligation FREE 14-day trial of Motion Trader, and see what an algorithmic trading approach could do for you.
Meet Jason

I'm Jason McIntosh, the creator of Motion Trader. My career began in 1991 on the trading floor at Bankers Trust. Nowadays, I trade my own systems from home in Sydney.
Motion Trader is for investors who value robust analysis, data driven entry and exit signals, commentary, and education. I use engineered algorithms to identify when to buy and sell ASX stocks. No biases or guesswork, just data driven signals.