Trade the Trend | Episode 45
By Jason McIntosh | Published 17 June 2022
Trade the Trend is a weekly video focusing on where the stock market is going. It’s for investors and traders looking for insights to the market’s next move. Jason uses technical analysis of stocks and trend following techniques to help you piece together the world’s biggest puzzle.
Where is the Stock Market Going?
00:00 Intro
00:37 An unprecedent statistic for the S&P 500
02:16 Where I’ve been wrong about the S&P 500
05:00 An alarming scenario for where the stock market is heading
09:13 What outcome does the S&P 500 Volatility Index point to?
12:00 This graph suggests a bear market low is getting close
14:36 What consumer sentiment says about future returns (this will surprise you)
17:14 This indicator has a 94% success rate since 1950
21:25 Why the ASX could do much better than the US
25:00 But avoid ASX stocks like these
26:29 This risky practice ruins so many traders
Transcript (abridged)
Please note: Charts available from video
Welcome to this week’s edition of “Trade the Trend,” a weekly video discussing where the stock market is going. I’m Jason McIntosh. It is Friday, the 17th of June, 2022.
Let’s start by looking at where the S&P 500 is heading during the current bear market.
It’s been an extraordinary week in equities. I saw a stat today. In five out of the last seven days, more than 90% of S&P 500 stocks were down. Now you might initially think that’s not surprising. But what is surprising is that according to the source there’s no precedent for this in the S&P 500’s history. The amount of selling has truly been overwhelming.
Ordinarily, extremes like we’ve seen lead to turning points. But when something’s unprecedented, we really shouldn’t overestimate our ability to predict outcomes. I think the best we can do is to consider scenarios. And that’s what we’re going to do today. We’re going to go over some scenarios about where the market could be going from here. Hopefully, that helps at least provide some framework to the huge amount of uncertainty we’ve been seeing through these last few weeks.
I want to start by talking about where I’ve been wrong over the last two months. My biggest error has been my optimism for larger bounces over the last six to eight weeks. I thought that the rebound off the May low was going to be a zigzag higher, and that we might get one more leg up. My view was that the market may then retest the lows around August or September. But this has all been happening way quicker than I was anticipating.
Where I have been right is that I’ve made ongoing calls to play defense. I’ve been saying to take cautious stance since the Nasdaq broke down in late January. It was at that time that I shifted my game plan from playing the rising trend to playing a defensive game and with the market below the moving averages.
Another key point is that I’ve been saying not to buy the dip. And I’ve also been talking about selling the rallies… I’ve been saying to use the rallies as an opportunity to clean up a portfolio and get rid of stocks which have been breaking lower. While I’ve been wrong about the extent of the bear market rallies, hopefully, the overall defensive playbook has been helping you get through what is a highly challenging period in the markets.
So, where does the stock market go from here?
Well, I’m going to start with a negative scenario, and it’s going to sound alarming. And I don’t want to be an alarmist. There are so many alarmists talking about markets… there always are. I read about one guy during the week who’s predicting a 70% decline. The thing to add onto that is he’s been talking about this since at least 2014. One year he could be right, but it still could be decades away.
So, while I don’t want to be an alarmist, this is a confronting scenario. I think it’s a scenario we do have to consider given the set-up which I’m seeing. The S&P 500 and the Nasdaq are currently in what I call a waterfall or a cascading set-up.
Let me show you what I mean on a chart:
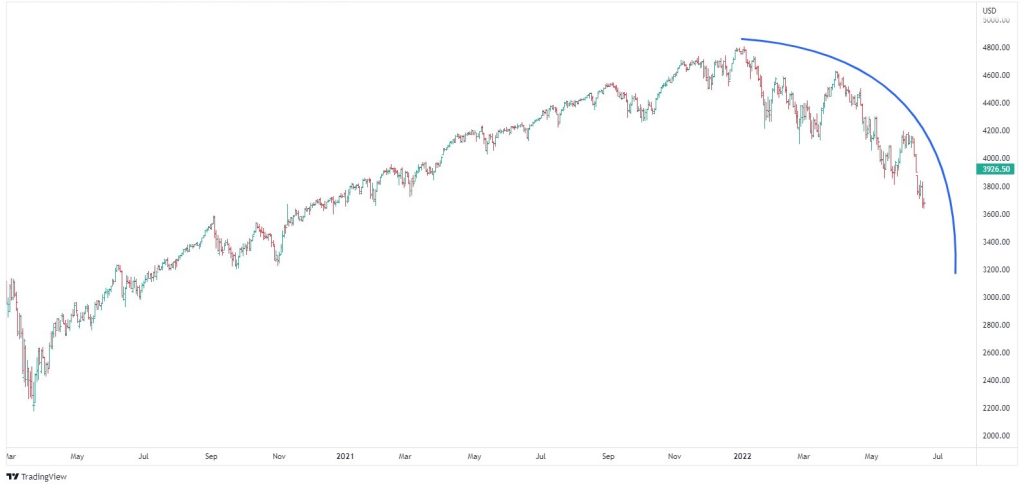
A cascading set-up is where the rallies get shorter, and the sell offs get steeper. Just follow the arc above the price action. The correction starts off routinely enough, but then crescendos into a sharp drop.
I’ve seen this pattern develop in many markets over the years. Not just in stock indices, but individual stocks, currencies, commodities, all sorts of markets. Sometimes I see this set-up on hourly charts, sometimes it’s on daily charts.
This type of pattern doesn’t appear every day. But it’s something I’ve noticed quite a bit over the years. As the cascading motion develops, the eagerness to sell intensifies. It can ultimately reach the point where the sellers overwhelm the buyers, and prices decline rapidly.
Let me show you a couple of examples from past markets:
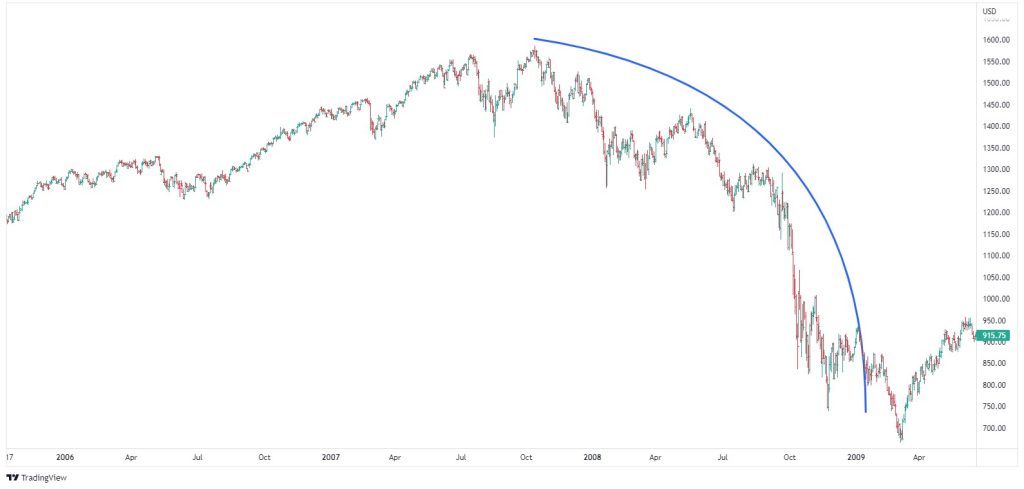
This the GFC sell-off. The S&P 500 lost over 50% during this period, with the steepest part of the falling occurring within a cascading pattern. Follow the arc above the price action. You’ll see the bounces get shorter and the declines accelerate.
Here’s another example:
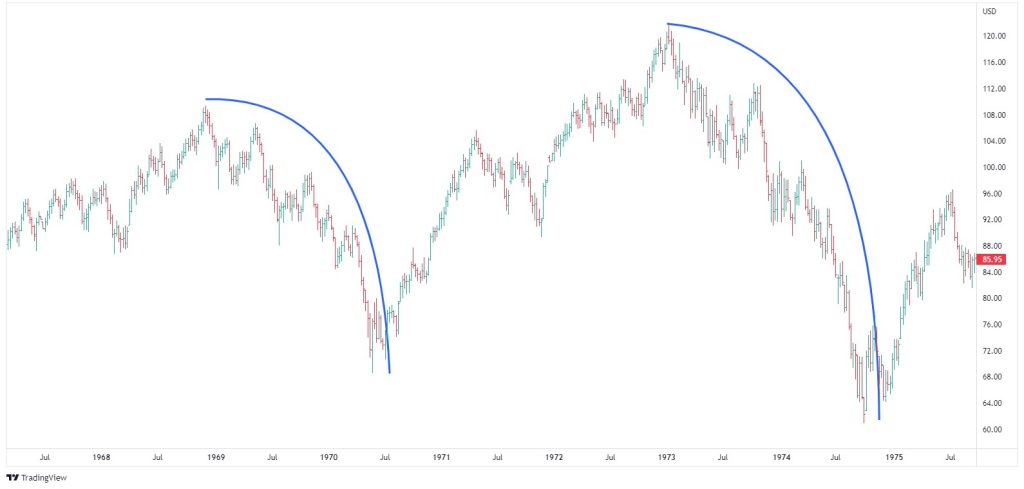
This chart goes back to the 1970s. You’ll see two examples of the cascading set-up — one between 1968 and 1970, and the other from 1973 to 1974. It’s a familiar story on both occasions…. The market gradually rolls over and then picks up speed as the decline intensifies. It’s really the capitulation of that final sell-off that creates the waterfall moment.
It’s also interesting look at the volatility index, or what we call the VIX (see video). You’ll see that it’s been coiling up within a range for several months. Final lows in markets are often associated with a surge in volatility. A capitulation sell-off would likely see the VIX break from its range and spike to the upside.
And just remember this isn’t a prediction. I’m simply outlining a possibility to help better prepare you if it does happen. You’ll have some framework around what could be unfolding. So, this is by no means a sure thing, this type of pattern which I’ve been talking about doesn’t always play.
But the set-up is there and it’s possible, and it’s another reason why I don’t want to try to forecast a bottom in S&P 500, ASX 200 or stock markets generally. I believe they remain vulnerable while they are below their 50 and 100-day moving averages. My suggestion is to still consider playing defence. I don’t think this is the time to go on the attack and start looking for bargains. People are doing that. Maybe it’ll work out, but the downside potential is still significant.
Please see video for more detailed analysis and charts
Looking for the best ASX stocks to buy now?
Motion Trader‘s algorithms scan more than 2,000 ASX stocks daily in search of medium term investment trends. We then tell our members precisely when to buy shares. And most importantly, we tell them when to sell.
Try a no obligation FREE 14-day trial of Motion Trader, and see what an algorithmic trading approach could do for you.
Meet Jason

I'm Jason McIntosh, the creator of Motion Trader. My career began in 1991 on the trading floor at Bankers Trust. Nowadays, I trade my own systems from home in Sydney.
Motion Trader is for investors who value robust analysis, data driven entry and exit signals, commentary, and education. I use engineered algorithms to identify when to buy and sell ASX stocks. No biases or guesswork, just data driven signals.