Trade the Trend | Episode 44
By Jason McIntosh | Published 10 June 2022
Trade the Trend is a weekly video focusing on where the stock market is going. It’s for investors and traders looking for insights to the market’s next move. Jason uses technical analysis of stocks and trend following techniques to help you piece together the world’s biggest puzzle.
Where is the Stock Market Going?
00:00 Intro
00:35 Where is the S&P 500 going?
05:16 Look what corporate insiders are doing
06:48 This headline could be a major contrary indicator
07:33 How do bear markets play out?
10:59 What does this breakout mean for the ASX 200?
13:10 This key sector could be in trouble
15:50 Avoid this strategy and this type of popular stock
20:52 Some of the best trading wisdom you’ll ever hear
24:00 Where to find insights, strategy, and analysis of stocks
Transcript (abridged)
Please note: Charts available from video
Welcome to this week’s edition of “Trade the Trend,” a weekly video discussing where the stock market is going. I’m Jason McIntosh. It is Friday, the 10th of June, 2022. As always, this is a general commentary and doesn’t take your personal situation into account.
Let’s start by analysing the technicals for the S&P 500. Up until Thursday, this had been the quietest eight days of the year. And that’s pretty remarkable because we’re now in the sixth month of the year. The fact it’s taken this long to have a relatively quiet week is extraordinary. But I think as we go into that Northern Hemisphere summer, it’s possible we’re going to get some respite from this relentless volatility that we’ve had over the last five months.
The first key technical level on the chart is a resistance band between 4,100 to 4,200. This region has so far contained the rally off the May low. And have retreated from this resistance on Thursday in the U.S.
Have a look at the chart of the S&P 500:
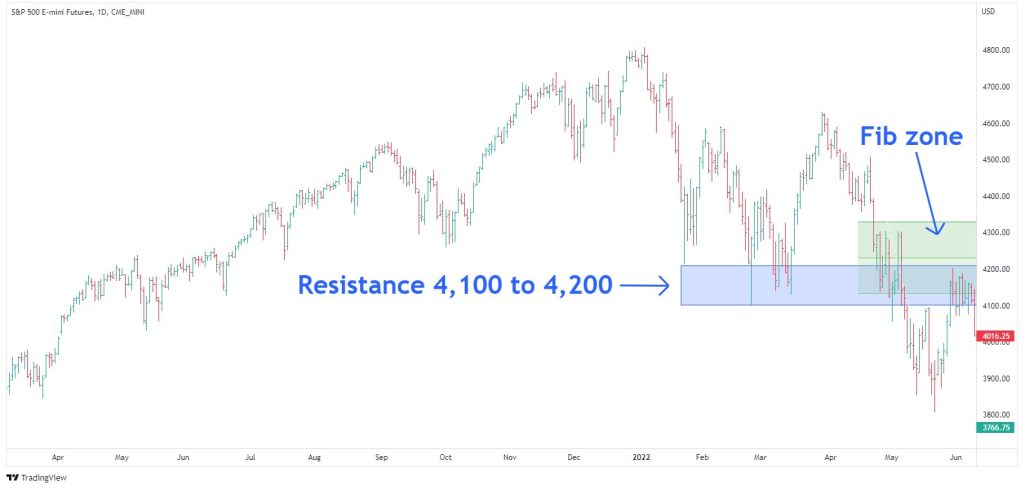
Another thing we can do is look at the Fibonacci retracements of the most recent decline. It’s interesting to see that the resistance band also coincides with this Fibonacci region. The recent rally got right to the 50% Fibonacci retracement of the decline from the March high. So, it’s a very natural place for this rebound to stall.
The question now is, are we going to see some follow-through selling?
Let’s go over to the four hourly chart to help find a possible answer. I like looking at these four hourly charts as well. They give a more detail than you get on the dailies, and you see those intra-day movements a little bit better. And this helps pieces together what could happen next.
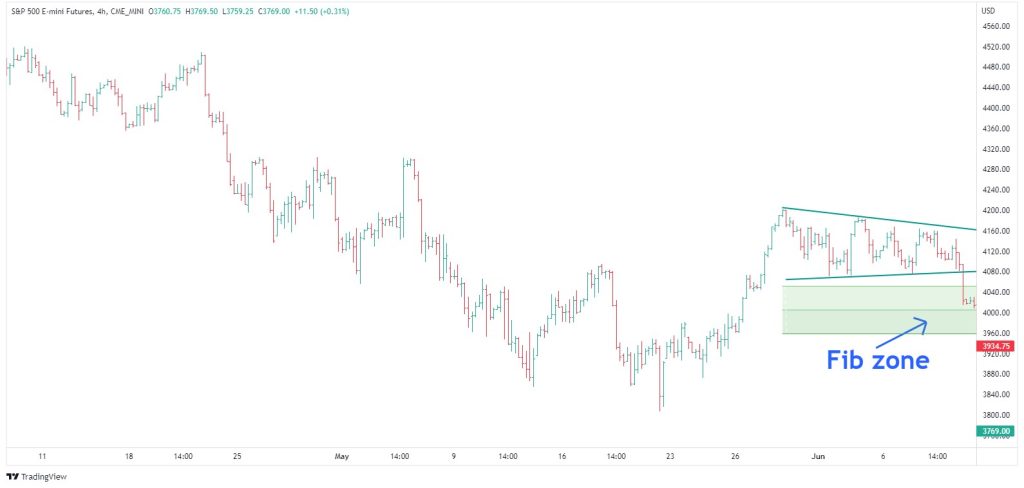
What we have is a technical pattern called a triangle. It’s one of those classic patterns that form during a period of sideways trading. And this is where the volatility has dropped away over the last eight days. You’ll see the range narrows until there’s a breakout. We never know which way it’s going to break. This time it’s broken to the downside.
Another thing we can do, is measure out the Fibonacci retracements of this latest rally. We can measure the move from the May low through to the high at the end of May. What we’ve seen so far is that the S&P 500 has come back to around the 50% retracement. And I think while this Fibonacci region holds, my feel is that this market will at some point have another test to the upside. It may not come in the next week. It’s possible we get several weeks of just chop where the market doesn’t do too much at all. And then we could get a pop higher towards. Maybe it’s towards the end of June. Maybe it’s sooner. Maybe it doesn’t happen at all, but that’s the feeling I get for this market.
I continue to believe that this is a bear market rally, and I don’t think that we’ve seen the final low yet but I think perhaps we do have a temporary low which is going to hold for potentially several weeks.
Now I saw an interesting graph through the week that came up from my Twitter feed. And it’s this one shows the ratio of corporate insider buying to selling (see video). And what we can see is that we’re seeing an increase in the rate of buying versus selling from insiders. So, these are people within the company who know the company well. People can sell their shares for all sorts of reasons. But insiders typically only buy when they see value in their stock.
Previous rebounds in insider activity have led to at least a temporary low. It’s going to be interesting whether the same thing happens here. Maybe there’s some underlying support to the market coming in, even if it’s just temporary. We’re not talking about a final low, but is there enough reason for the market just to hold the line for the near term and potentially give it a little bit more strength?
I saw another interesting article through the week. It was in Investor’s Business Daily and the headline says it all: Federal Reserve’s Most Anticipated Recession in History May Be Coming. There’s so much talk of this impending recession and maybe it is on the horizon. Interest rate hiking cycles, almost always end in recession. But they can take a while before they come.
With all this negativity in the market, it does lend the question, is there room for a continued rebound over the next few weeks? The sentiment is still very bearish. And the way bear markets work is to inflict the most pain possible. They just make it hard. They make it unpleasant, and they typically don’t just go down in a straight line. The Covid crash and recovery is something which you almost never see. Bear markets often zigzag lower and they’re difficult. And they rally, they draw people in, and then they fall again. And I wonder whether the negative sentiment we’re seeing at the moment is enough to get a bit more of a rebound before the S&P 500 retest those lows.
And just remember this. This bear market so far has only been five months in duration and the average bear market will go for around nine months. That’s the average of bear markets over the last 100 or so years. They go for around nine months. So, of course, this could be a shorter than average bear market, and perhaps the market does continue to move higher. Or it could be a case that we do see more sideways, more chop, and this continues to drag out. That would be my base case at this point. The COVID crash and recovery was exceptional, not normal, and I think people who have come to the market recently think this is how bear markets recover, in a V shape. It’s typically not how they recover. They tend to be grinding and they tend to be drawn out and difficult.
Hopefully, these observations are helping you. I know how hard these bearish periods can be, so I hope I’m able to use my experience to help you come out the other side, to give you some perspective, to give you some ideas on what form or what shape this ongoing correction/bear market could take.
My feel is that June and July could see the markets whipsaw, and potentially later in the year, maybe it’s August, September, maybe we see another bout of weakness then. That, of course, is just speculation. But, at end of the day, I think it’s all about taking a cautious stance to this market. Yes, there’s a potential for some further upside, but I think, really, this is a market to be very wary of, and be very cautious with.
Please see video for more detailed analysis and charts
Looking for the best ASX stocks to buy now?
Motion Trader‘s algorithms scan more than 2,000 ASX stocks daily in search of medium term investment trends. We then tell our members precisely when to buy shares. And most importantly, we tell them when to sell.
Try a no obligation FREE 14-day trial of Motion Trader, and see what an algorithmic trading approach could do for you.
Meet Jason

I'm Jason McIntosh, the creator of Motion Trader. My career began in 1991 on the trading floor at Bankers Trust. Nowadays, I trade my own systems from home in Sydney.
Motion Trader is for investors who value robust analysis, data driven entry and exit signals, commentary, and education. I use engineered algorithms to identify when to buy and sell ASX stocks. No biases or guesswork, just data driven signals.