Trade the Trend | Episode 42
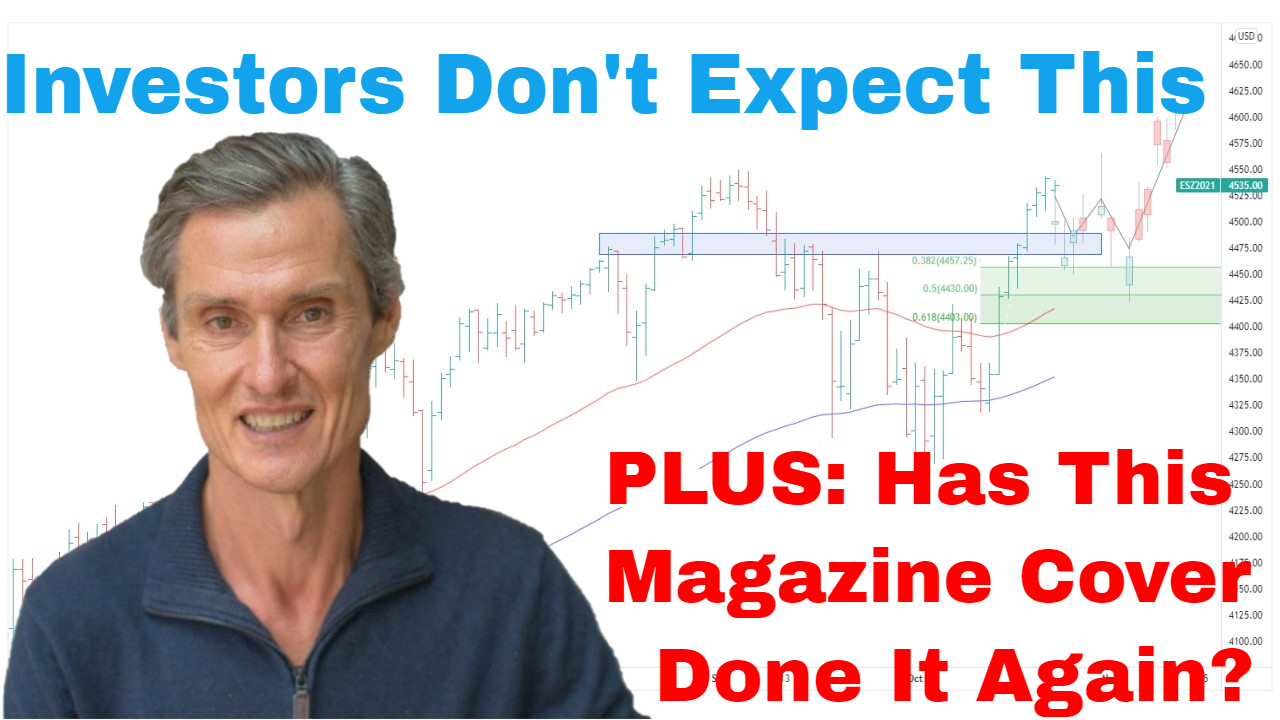
By Jason McIntosh | Published 27 May 2022
Trade the Trend is a weekly video focusing on where the stock market is going. It’s for investors and traders looking for insights to the market’s next move. Jason uses technical analysis of stocks and trend following techniques to help you piece together the world’s biggest puzzle.
Where is the Stock Market Going?
00:00 Intro
00:37 Where is the S&P 500 going?
04:17 What is the VIX doing?
05:57 Where is the Nasdaq going?
11:21 Sentiment indicators bouncing off extremes
15:11 How I help self directed investors
16:13 Where is the ASX 200 going?
18:27 Where is the ASX small caps going?
21:37 Two sentiment graphs you have to see
25:42 What should investors do now?
Transcript (abridged)
Please note: Charts available from video
Welcome to this week’s edition of “Trade the Trend,” a weekly video discussing where the stock market is going. I’m Jason McIntosh. It is Friday, the 27th of May, 2022. As always, this is a general commentary and doesn’t take your personal situation into account.
It’s been an interesting week in the S&P500. We’re seeing some early signs that the bounce we’ve been discussing over the last few weeks is underway. And what makes this even more interesting is that it’s happening off a Fibonacci retracement region.
If you’ve been following my commentary, you’ll know that I believe the S&P 500 is correcting the entire advance from the March 2020 lows. So, when we measure the Fibonacci retracements, we want to use what we believe is a complete move. When we measure the Fibonacci retracements from the March 2020 low to the recent peak, it’s interesting see the S&P 500 has come back down to the 38.2% retracement. I believe this is a very natural place for a rally to occur from.
Here’s the chart:
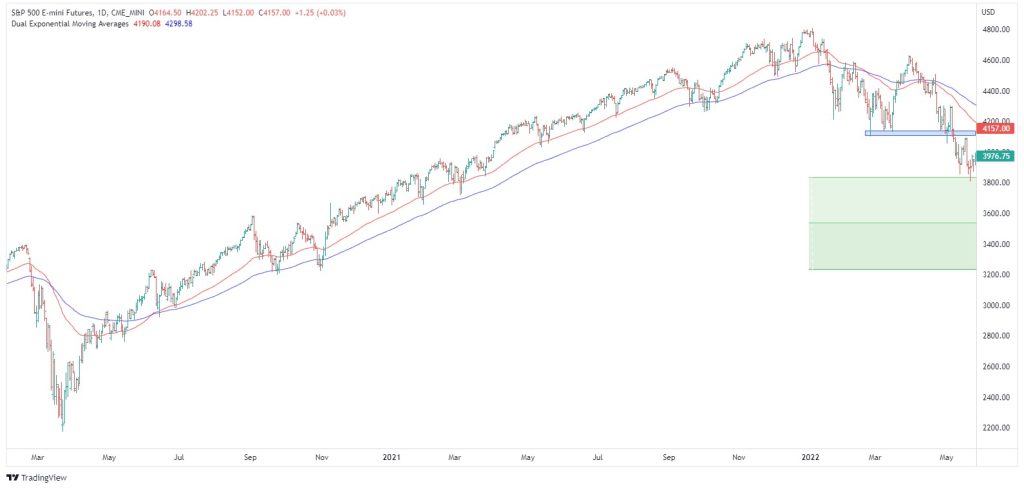
And we can also do a measured move on the first leg of the decline (see video). If you’re wondering, a measured move is a technical technique for identifying target zones. Measuring from the January high to the March swing low, and then projecting that measurement down from the March high, we get a target right near the recent lows. So, we have a couple of points suggesting this could be a temporary low from which the S&P 500 could rally.
The first target is resistance at 4,100 this was previously a support zone). After that, levels towards 4,200 and 4,300 are possible (these are Fibonacci retracements of the sell-off from the March high).
Let’s jump to the Nasdaq.
And this is a fascinating set-up as the Nasdaq has had one of its biggest and most persistent sell offs in history. It’s been down seven weeks in a row. You have to go back to 2011 to see a decline of similar duration. But the market only lost 10% during that period. That was followed by a strong rebound.
Prior to this, the last string of seven consecutive losses was during the GFC. The Nasdaq fell a similar 25% over seven weeks. But then fell heavily in the eighth week of decline.
I don’t think the market is set-up for a GFC style capitulation over the next week or two. So historically, prices are at oversold levels. Prior to the GFC, you got to go back to the dot-com period to find another seven-week stretch of losses. So, it’s rare to get this big sequence of losses.
Based on that, we can say that by historic standards, the market is stretched to the downside. And at some point soon, I believe we’ll see a strong relief rally.
Let’s look at that chart:
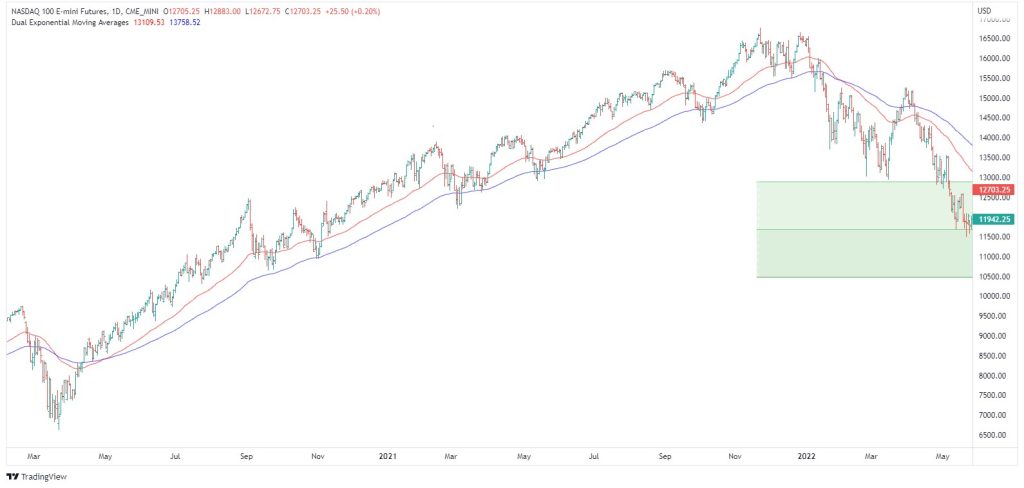
You can see the Nasdaq is showing a classic zigzag decline. This is typical of so many corrections. You get the A, B, C zigzag. We can also do a measured move (see video) which comes right to the recent low.
Also note the Fibonacci retracement levels. The Nasdaq has fallen right to the 50% retracement zone. There are early signs of a rally. And just like with the S&P 500, I believe this is a natural place for a swing low (or temporary low) to occur.
I want to stress that I’m not calling a final low, and I’m not calling for a new bull. I’m just talking about the potential for a technical bounce or a bear market rally in an index, which by historical measures, is at extreme levels.
It’s also interesting to look at some market breath indicators. These can be helpful in gauging where a market is. And a group of indicators which I always keep a keen eye on is the number of stocks above their moving averages.
First is the number of Nasdaq stocks above their 50-day moving averages. It’s starting to bounce after getting down to only around 5% of stocks being above their moving averages. Once it rebounds, it tends to build up a bit of momentum.
And then we can look at the number of stocks above their 200-day moving average. Now, this is also fascinating. I’m going to show you a weekly chart going back to 2007.
Have a look at this:
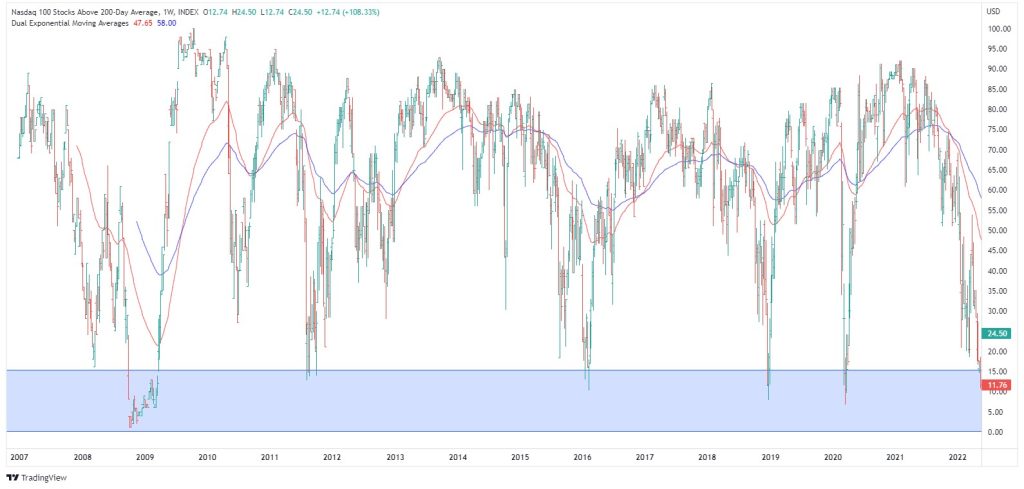
This is interesting. You’ll see the indicator only falls back to the blue zone once every few years. And when it does, it typically only stays in the zone for one to three weeks. The GFC was an exception. But even then, it quickly started to move higher.
The point is that stocks don’t stay below their 200-day moving averages on mass for a long period of time. Look at where the indicator is now. I believe this is another sign the market is due for a bounce from oversold levels.
Please see video for more detailed analysis and charts
Looking for the best ASX stocks to buy now?
Motion Trader‘s algorithms scan more than 2,000 ASX stocks daily in search of medium term investment trends. We then tell our members precisely when to buy shares. And most importantly, we tell them when to sell.
Try a no obligation FREE 14-day trial of Motion Trader, and see what an algorithmic trading approach could do for you.
Meet Jason

I'm Jason McIntosh, the creator of Motion Trader. My career began in 1991 on the trading floor at Bankers Trust. Nowadays, I trade my own systems from home in Sydney.
Motion Trader is for investors who value robust analysis, data driven entry and exit signals, commentary, and education. I use engineered algorithms to identify when to buy and sell ASX stocks. No biases or guesswork, just data driven signals.