Trade the Trend | Episode 41
By Jason McIntosh | Published 20 May 2022
Trade the Trend is a weekly video focusing on where the stock market is going. It’s for investors and traders looking for insights to the market’s next move. Jason uses technical analysis of stocks and trend following techniques to help you piece together the world’s biggest puzzle.
Where is the Stock Market Going?
00:00 Intro
00:21 Where is the S&P 500 going?
04:25 Where is the Nasdaq going?
07:02 Where is the Russell 2000 going?
09:26 What is the VIX doing?
12:00 What is market breath doing?
15:58 Is the stock market getting cheap?
17:32 Sentiment indicators nearing extremes
19:08 Where are fund manager cash levels?
21:04 What I do for self directed investors at Motion Trader
22:46 What are European, Asian, and Emerging markets doing?
25:43 Where is the ASX 200 going?
Transcript (abridged)
Please note: Charts available from video
Welcome to this week’s edition of “Trade the Trend,” a weekly video discussing where the stock market is going. I’m Jason McIntosh. It is Friday, the 20th of May, 2022. As always, this is a general commentary and doesn’t take your personal situation into account.
It’s been another week of high volatility in the stock markets. The S&P 500 began the week with signs it was getting the bounce I discussed last week. It had a couple of good days early in the week. But after reaching the 50% Fibonacci retracement of the last leg down (green zone on the following chart), we saw a swift reversal back to the lows.
Here’s the chart:
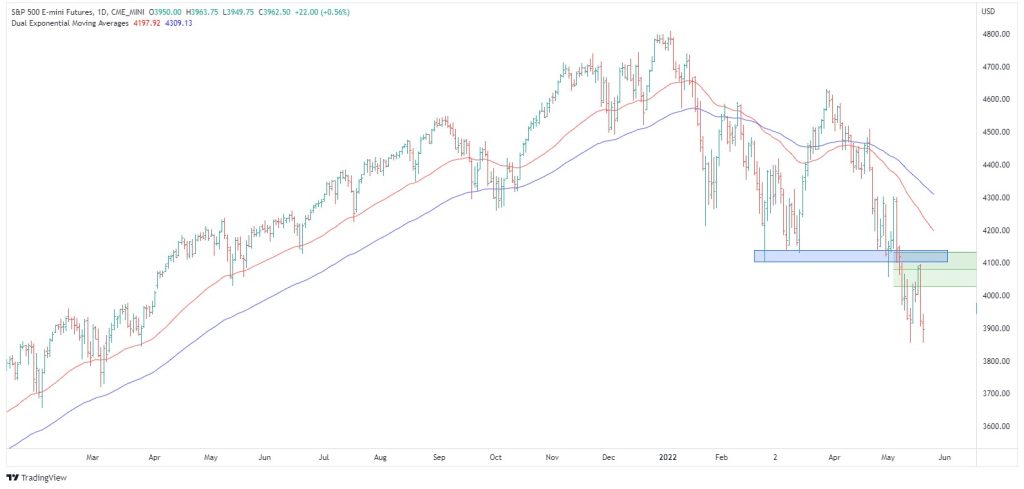
You’ll see that the bounce also got back to a previous support zone at around $4,100, which is now resistance (blue band). But it couldn’t sustain those levels and seen that shift reaction back down.
This is just the high volatility environment that we’re currently in. And I think these are the conditions which we need to be prepared for over the coming weeks and possibly over several more months.
I think the stock market is at a critical point. There are a couple of scenarios that could play out. The first is that if the S&P 500 can’t hold around 3,850, there’s a risk that it has a fast capitulation type selloff. If this happens. I believe it could occur over the next couple of days.
The alternate is maybe it’s more like what we saw in mid-March, where the S&P 500 had a rebounded off a double bottom formation. And that was the launching pad for a 12% rally over the following two weeks. That’s my favoured view at this stage.
And what I want to do today, is to go through some charts and try and look for some clues to how that could happen. I want to help you understand how the stock market could be close to starting a notable rally (not a new bull market, just a notable rally).
Let’s jump to the Nasdaq:
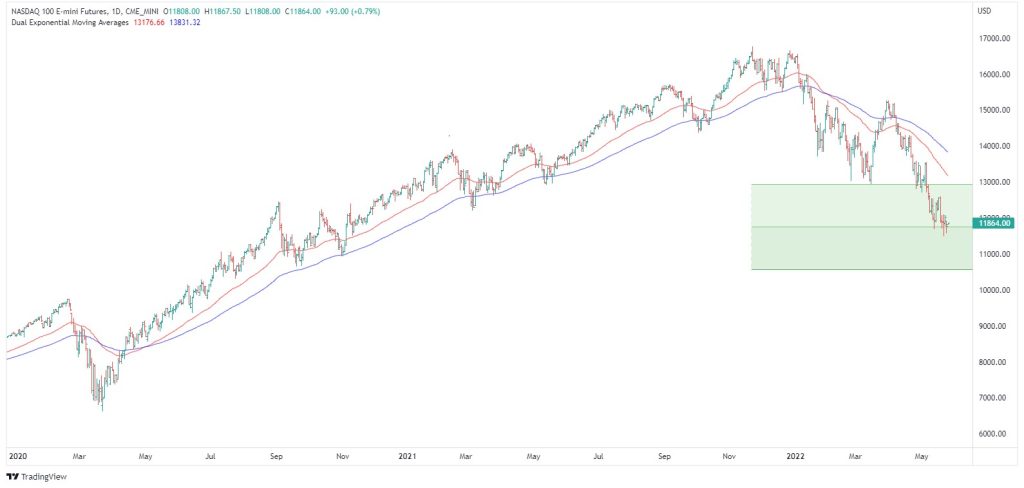
This chart includes the Fibonacci retracement levels. I’ve measured the retracements from the Covid lows. And what we see is the Nasdaq has come right back to the 50% retracement of the rally from March 2020 to the peak in November last year.
We can also do a measured move which is interesting (see video). A measured move is a technical technique that gives us potential target levels. If we start from the November high, take in the swing low in March, and then project off the high in late March, we find that the Nasdaq is currently right in the target area.
So, this would be a very natural place for another swing low to occur. And then from here, the Nasdaq (and S&P 500) could potentially have a meaningful rally.
If the Nasdaq were to bottom around current levels (at least temporarily), we can use Fibonacci retracements to get some upside targets. Measuring from the March high to the current low, we get a Fibonacci retracement region around $13,000 to $13,500. That’s a potential upside target of 10% to 15% in the Nasdaq, and similar percentages in the S&P 500.
The potential for a meaningful rally over the next several weeks certainly exists. But again, I stress that I’m not talking about a new bull market, merely a notable rally which could last several weeks.
Next-up, I want to discuss the Russell 2000, which is the U.S. small-cap index. I believe that this is an important part of the puzzle.
Here’s the chart:
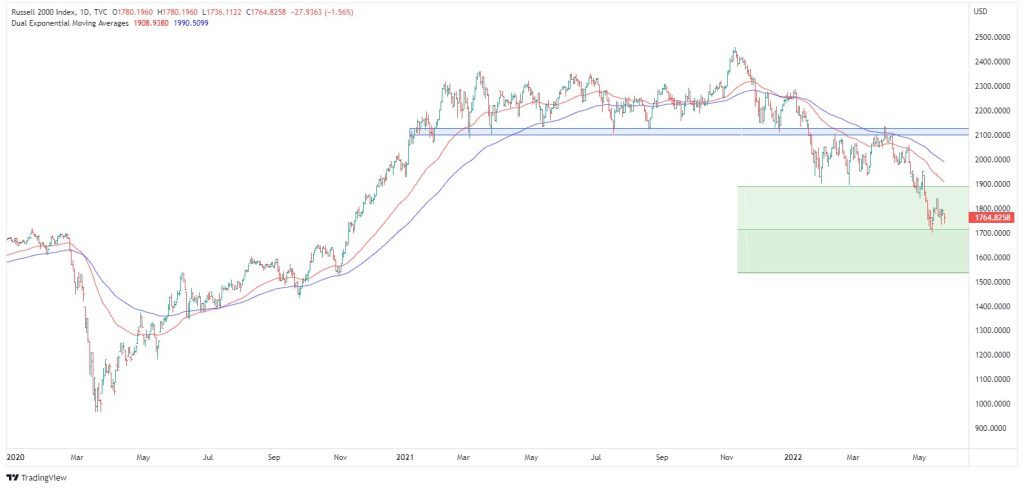
What stands out to me on is that there’s some divergence playing out. Despite the selling we’ve had in the U.S. during the second half of the week, the Russell hasn’t gotten anywhere near its low from last week. We have a situation where the S&P 500, the NASDAQ, and the Dow have either made, or are very close to making, a new low. Whereas the Russell hasn’t. That’s potentially a sign that the latest washout in the stock market is close to done.
And it’s interesting again to consider the Fibonacci retracement levels. I love these Fibonacci levels because so often the markets gravitate back towards them during corrective periods. They can be good at giving target points. These aren’t magic figures, and they don’t act as an invisible force. Sometimes the market goes straight through them. But there are many times when they do work, so they’re worth paying attention to.
We currently have two of the main indices: the Russell 2000 and the Nasdaq, sitting on 50% retracements. I believe this opens that window for a potential swing low and a notable rally. I’m not talking about a new bull market but a notable rally which could last several weeks.
Please see video for more detailed analysis and charts
Looking for the best ASX stocks to buy now?
Motion Trader‘s algorithms scan more than 2,000 ASX stocks daily in search of medium term investment trends. We then tell our members precisely when to buy shares. And most importantly, we tell them when to sell.
Try a no obligation FREE 14-day trial of Motion Trader, and see what an algorithmic trading approach could do for you.
Meet Jason

I'm Jason McIntosh, the creator of Motion Trader. My career began in 1991 on the trading floor at Bankers Trust. Nowadays, I trade my own systems from home in Sydney.
Motion Trader is for investors who value robust analysis, data driven entry and exit signals, commentary, and education. I use engineered algorithms to identify when to buy and sell ASX stocks. No biases or guesswork, just data driven signals.