Trade the Trend | Episode 40
By Jason McIntosh | Published 13 May 2022
Trade the Trend is a weekly video focusing on where the stock market is going. It’s for investors and traders looking for insights to the market’s next move. Jason uses technical analysis of stocks and trend following techniques to help you piece together the world’s biggest puzzle.
Where is the Stock Market Going?
00:00 Intro
00:21 Where is the S&P 500 going?
06:03 Sentiment indicators nearing extremes
10:44 What I’ll be doing if the market rallies
11:50 What Apple’s latest price action means for the market
12:50 If you’re finding this market hard, watch this
15:59 Where is the ASX 200 going?
19:00 Where is the ASX Small Ordinaries going?
20:44 Where is the US dollar going?
24:25 Where is gold going?
Transcript (abridged)
Please note: Charts available from video
Welcome to this week’s edition of “Trade the Trend,” a weekly video discussing where the stock market is going. I’m Jason McIntosh. It is Friday, the 13th of May, 2022. As always, this is a general commentary and doesn’t take your personal situation into account.
Let’s start with the S&P 500:
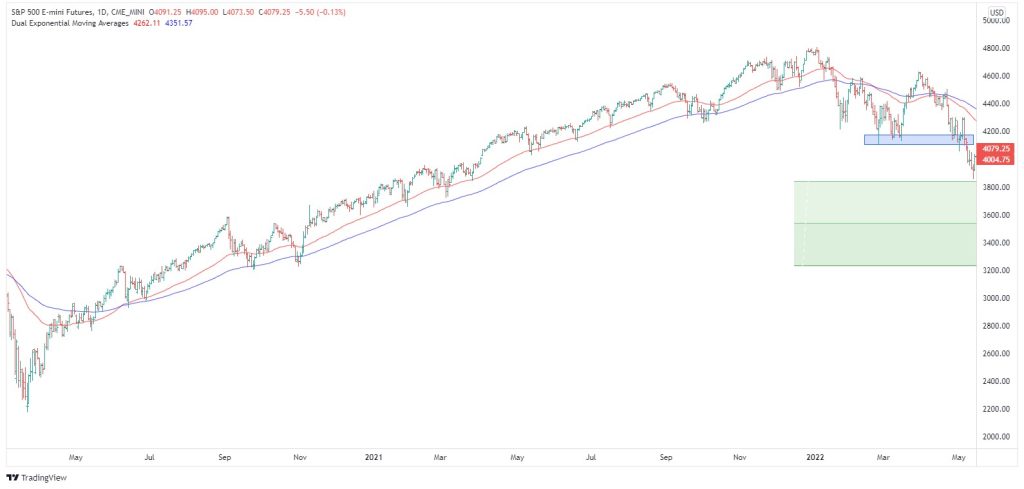
It’s been another big week in the S&P as well as global equities, in general. And the S&P 500 has just carved through the support we were speaking about last week at 4,100. It was only a relatively minor support zone but nonetheless, I thought the market may have been able to muster up some sort of a bounce.
Last week, I highlighted that we the first leg of the decline was in a zigzag formation. And I thought we may have bounded off support over the next a week or two. And then from there, maybe we’d start another decline down to towards 3,900.
But that’s not what happened. The market has just cut straight through support without bouncing. And that’s just the nature of bear markets and corrective periods. They’re just so unpredictable, and they lack that consistency of a rising trend. This makes plotting the course that much more difficult.
But I think that overall, we the scenario that we’ve been talking about is playing out. I’ve been saying this is a big corrective phase from the COVID, and it’s largely been following that script. When we put on the Fibonacci retracements on that entire rally, we’re now getting very close to this 38.1% retracement, which is the upper boundary of the Fibonacci zone.
And it’s interesting the S&P 500 got within a whisker of a 20% decline last Thursday. And what’s significant about that is that 20% is the technical definition of a bear market. The S&P500 has been down around 19.8%, so effectively, you’d say the S&P 500 is in a bear market.
Technically, the S&P 500 needs to go a touch lower to official be in a bear market, but when you look around the globe, you look at other indicies in the U.S., you look at the NASDAQ, you look at the Russell, they’re both down over 20%. Looking to Europe, we’ve seen markets down over 20% from their high to their low. The same can be said for Japan and many emerging markets.
In Australia, a lot of stocks are down by over 20%. So, this whole global equity scene, is very much in correction, and we have pretty much bear market conditions all around.
And what’s been happening is this has been unfolding faster than I thought. But it’s now reaching a point where it’s completed a measured move. This is really interesting because what we can do, we can measure this out on the chart (see video). If we use the high point and we come down to what was a swing low, project up to the upward reaction off that low, and then we can project down again. And that gives us a measured target.
Now, a measured move is a technical measure which we can use for identifying potential levels that the market might get to. These are by no means magic levels. They don’t work like a magnet or anything like that, and there’s certainly no guarantee that the market is going to get there. But quite often, they do give us a good guide. So, it’s interesting to note that the market is at this measured target now (around 3,900), which is also just above this Fibonacci retracement zones.
Whilst I’ve been wrong in my optimism for a bounce over the last couple of weeks, I did think we could get a bounce here. The market does appear to be quite oversold at this point, and we are getting quite stretched from below the 50-day moving average. The Moving averages are like an elastic band. The further away from the moving averages the market gets, the greater the odds of a mean-reverting rally which slingshots it higher.
By no means does that suggest there’s some new bullish phase starting. I think we’re a long way from that, but it’s just to relieve the short-term oversold conditions that the market appears to me to be showing signs of. This would be a very natural place for that rebound to occur.
But as I’ve been saying in recent weeks, this remains a time to be defensive. A significant development during the week was Apple breaking below support.
Have a look at this chart:
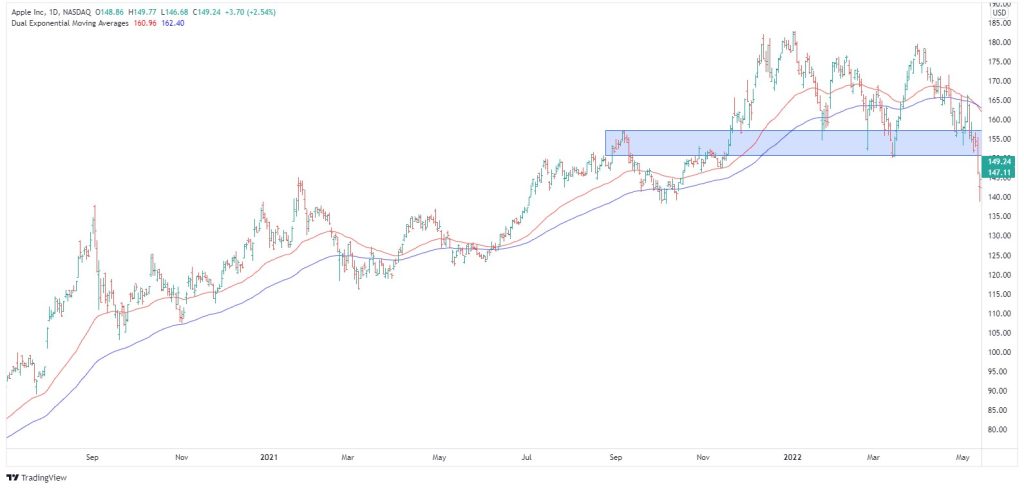
Apple is the largest stock in the S&P 500, and it broke down through a support zone around $155 to $150. The 50 and 100-day moving averages now appear to be crossing to the downside. So, this is now a technically quite a weak structure, and being the largest stock in that S&P 500, it’s hard to see how the market is going to make a lasting low at this point with Apple just having broken down.
And then you look at stocks like Microsoft and Alphabet (the company Google operates under). They’ve also broken below supports and they’re below moving averages. So, as I say, this is still a time for defence. This is not a time for looking for lows.
I don’t think we should expect the continued one-way traffic we’ve been seeing in the S&P 500. This has been quite a one-way trip down. It’s been a 16% fall in around 5 weeks. So, I don’t think we should continue to see that one-sided price action. But I do think it’s going to take… It could take quite a few months of work to get through this period.
Looking for the best ASX stocks to buy now?
Motion Trader‘s algorithms scan more than 2,000 ASX stocks daily in search of medium term investment trends. We then tell our members precisely when to buy shares. And most importantly, we tell them when to sell.
Try a no obligation FREE 14-day trial of Motion Trader, and see what an algorithmic trading approach could do for you.
Meet Jason

I'm Jason McIntosh, the creator of Motion Trader. My career began in 1991 on the trading floor at Bankers Trust. Nowadays, I trade my own systems from home in Sydney.
Motion Trader is for investors who value robust analysis, data driven entry and exit signals, commentary, and education. I use engineered algorithms to identify when to buy and sell ASX stocks. No biases or guesswork, just data driven signals.