Trade the Trend | Episode 39
By Jason McIntosh | Published 6 May 2022
Trade the Trend is a weekly video focusing on where the stock market is going. It’s for investors and traders looking for insights to the market’s next move. Jason uses technical analysis of stocks and trend following techniques to help you piece together the world’s biggest puzzle.
Where is the Stock Market Going?
00:00 Intro
00:21 Why the low probably isn’t in for stocks (and how you should play it)
13:04 This sentiment indictor hasn’t been at these levels since 1992
20:10 What does this “triple top” pattern mean for the ASX 200?
23:56 Avoid buying this type of stock (it could ruin your portfolio)
25:50 Be ready if gold breaks this key level
28:34 This could be a mega trend in waiting
Transcript
Please note: Charts available from video
Welcome to this week’s edition of “Trade the Trend,” a weekly video discussing where the stock market is going. I’m Jason McIntosh. It is Friday, the 6th of May, 2022. As always, this is a general commentary and doesn’t take your personal situation into account.
All right. With that said, let’s jump to our first chart: the S&P 500.
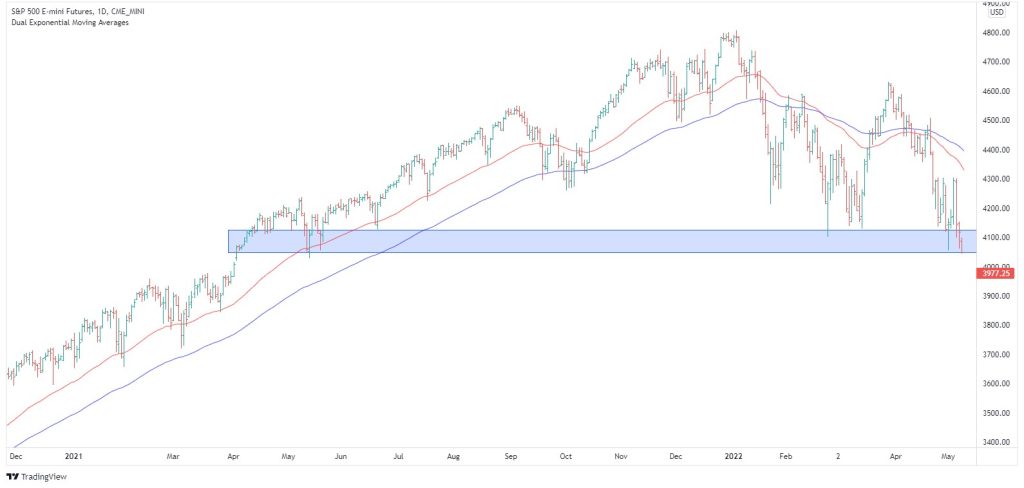
If we were just looking at closing levels, you’d think that it actually been a pretty quiet week, as the market is around the same level as a week ago. But the S&P 500 has traded in a range of nearly 6%. So, there’s been a lot of movement despite the underlying price being nearly unchanged. And that’s just the nature of these corrective periods. By nature, they’re volatile and they’re really difficult to make money in, even if you’re a short seller.
If you’d been trying to short this market, the strength of the short-covering rallies makes it hard to stay in. And the risk-reward parameters of trying to trade short in these markets is often patchy. Corrections lack the consistency of the upward trends during a bull market. That’s why I say they are difficult periods.
In terms of support, there’s not a lot to work with at current levels. There’s some support around the 4,100. It picks up some lows from May 2021, and we have the lows from just recently. Other than that, there’s not a whole lot going on here support-wise because the market is near historic highs.
Also, the rally off the COVID lows was quite a fast and powerful. There wasn’t a lot of work done, so that’s why we don’t have a great deal of support to hinge our analysis from.
But that said, the support so far has been holding through the week despite all that volatility that we’ve been seeing. And I think one of the possibilities that could be playing out is that we could be getting a double zigzag downward movement. The first zigzag was from the high through to the March lows. Then we’ve had a big short-covering rally. It’s possible that we’re now getting a second zigzag.
And we can also do a measured move of this first decline. In a measured move, we get a target somewhere down around the 3,900 mark. And that’s about 18% below the highs. So, it’s possible that this is how the market gets to that long awaited 20% correction that has been speculated and spoken about for maybe about a year or so now. And I’ve been talking about this for the last couple of months… I’ve been saying that this whole pullback is a correction of the entire advance off the COVID lows, which would be quite natural to see a 20% correction. This is something markets do, on average, maybe every couple of years.
It’s also interesting to look at some Fibonacci retracement levels.
Have a look at this:
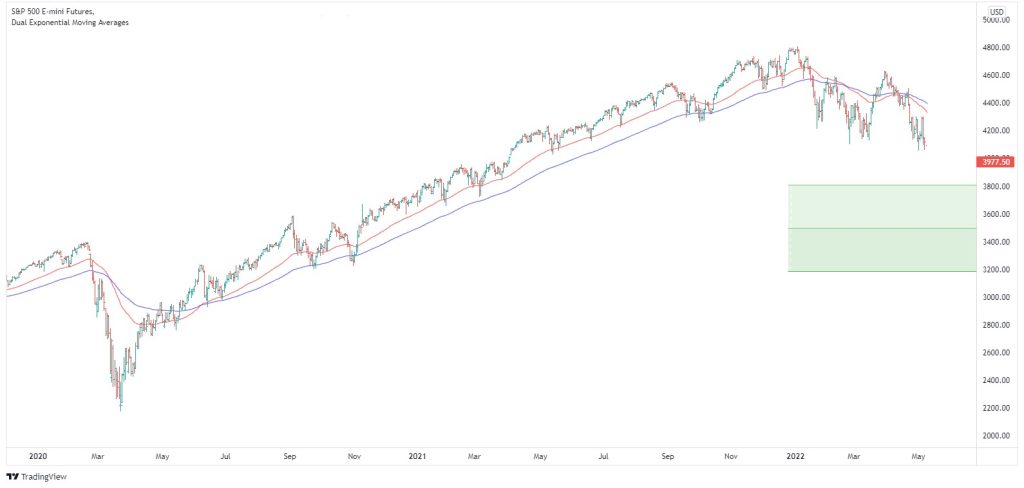
Measuring from the COVID lows up to the high, you see that upper boundary of the Fibonacci’s comes in just below where this measured plays out (green shaded area). The measured move is more of a target rather than the specific technical point, but it gives us a level to work with.
So, we have a cluster of potential targets towards 3,900. This is just a possibility. That may not be what’s happening, but either way, I don’t think this is a tradeable move for most people.
I think that simply being aware of this scenario can help because most people are just watching the ups and downs on the nightly news. When you do that, it really can feel like you’re in a rudderless boat during a storm. You don’t know what’s going on. At least when you understand some of the scenarios, some of the possibilities, emotionally, I think it does help because you get some idea of where things could be going.
I think the play at the moment remains being highly selective with buying, and I think it’s also about exiting stocks or selling stocks that are losing too much ground. My strategy is to give stocks room to move, but if they lose too much ground, I believe it’s really important to cut them because you don’t know how low a correction can go.
And that’s what I do, I use trailing stop losses on all of my trades. That means I’ve got an exit point. I’ve got a pre-calculated exit point that I use for each stock. And that’s one of the things I do with my Motion Trader subscription service. It helps members protect their capital.
The winners out of these periods tend to be the people who lose the least. Just about everyone loses money during these periods. They’re a difficult and frustrating part of the cycle. And now isn’t the time for bold plays. I think trying to buy the low is just a risky game and leads to trouble.
Looking for the best ASX stocks to buy now?
Motion Trader‘s algorithms scan more than 2,000 ASX stocks daily in search of medium term investment trends. We then tell our members precisely when to buy shares. And most importantly, we tell them when to sell.
Try a no obligation FREE 14-day trial of Motion Trader, and see what an algorithmic trading approach could do for you.
Meet Jason

I'm Jason McIntosh, the creator of Motion Trader. My career began in 1991 on the trading floor at Bankers Trust. Nowadays, I trade my own systems from home in Sydney.
Motion Trader is for investors who value robust analysis, data driven entry and exit signals, commentary, and education. I use engineered algorithms to identify when to buy and sell ASX stocks. No biases or guesswork, just data driven signals.