Trade the Trend | Episode 37
By Jason McIntosh | Published 22 April 2022
Trade the Trend is a weekly video focusing on where the stock market is going. It’s for investors and traders looking for insights to the market’s next move. Jason uses technical analysis of stocks and trend following techniques to help you piece together the world’s biggest puzzle.
Where is the Stock Market Going?
00:00 Intro
00:21 S&P at key level: Will it be a bounce or a breakdown?
07:07 What does this classis chart pattern mean for the Nasdaq?
09:18 This is the line in the sand for European stocks
10:46 Could the German DAX get a repeat outcome?
12:03 ASX 200 on the verge of an all-time high. But watch for this.
14:32 Watch this before buying the ASX Small Ordinaries
17:04 Doing this could beat an ETF by a big margin
Looking for the best ASX stocks to buy now?
Motion Trader‘s algorithms scan more than 2,000 ASX stocks daily in search of medium term investment trends. We then tell our members precisely when to buy shares. And most importantly, we tell them when to sell.
Try a no obligation FREE 14-day trial of Motion Trader, and see what an algorithmic trading approach could do for you.
Transcript
Please note: Charts available from video
Welcome to this week’s edition of “Trade the Trend,” a weekly video discussing where the stock market is going. I’m Jason McIntosh. It is Friday, the 22nd of April, 2022. As always, this is a general commentary and doesn’t take your personal situation into account.
Last week I spoke about the need for the S&P 500 to hold support around 4,350. It was a case of buyers needing to come in and buy the dip to support the market and start pushing prices higher. And early in the week, that was what we saw happening, and we did get a bit of a rise in the early part of the week.
But on Thursday we got quite an upheaval in the market with talk that the Fed may raise interest rates by 50 points multiple times. And one of the investment banks, Nomura Holdings, came out and said that it’s expecting two 75-point rate hikes. So that really sent the market into a mini tailspin.
I think the interest rate pan is now really heating up. There’s been a lot of talk of rate hikes and higher inflation rates in the U.S. over the last few months, and it’s now intensifying.
Let’s turn to the charts and do some technical analysis on the S&P 500:
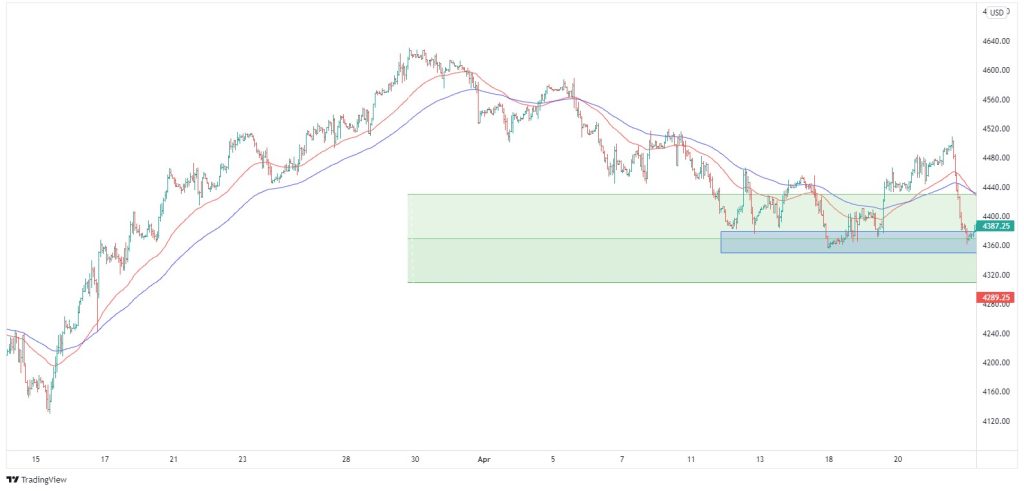
This is the hourly chart for the S&P 500. It’s interesting to take a close look at this price action, and the hourly chart gives some extra detail. You can see the sharp move lower on Thursday. It’s in contrast to the steady grinding rally we’d seen through the week. That was the “buy the dip” that I was discussing, and it did look constructive, but it’s all been unwound very quickly.
The S&P 500 has come back to a support region around that 4,350 mark. You can see it picks up some previous lows. And it’s going to be interesting to see how the market handles this from here.
What we can also do is add some Fibonacci retracement levels to the chart. This takes in the whole leg higher from mid-March through to the end of March. And you can see we’re right here in the 50% retracement area. This is where I’d expect the market to find support, if that’s what’s going to happen.
And there’s a lot of talk out there now about interest rates and inflation. But what’s interesting is the market is still managing to hold the line around this key 50% region. And I think it’s going to be very interesting on Friday, in the U.S., to see what happens, to see whether this level can continue holding. I’m thinking that if the market can hold around here, it could quickly snap back next week, back up towards 4,400 and beyond. And I still think that a retest up towards 4,600 is possible.
To me, this whole structure doesn’t look like it’s set up for a sizeable fall. Anything is possible, and this could, of course, change. But at this point in time, my feeling is the market will hold here, and I think there’s a strong possibility that we do still see some sort of a bounce higher. I’m not talking about a new bull market. But I don’t think the market’s going to continue to fall away here.
Now, let’s go over and have a look at the Nasdaq, because, of course, that’s also a big part of this puzzle.
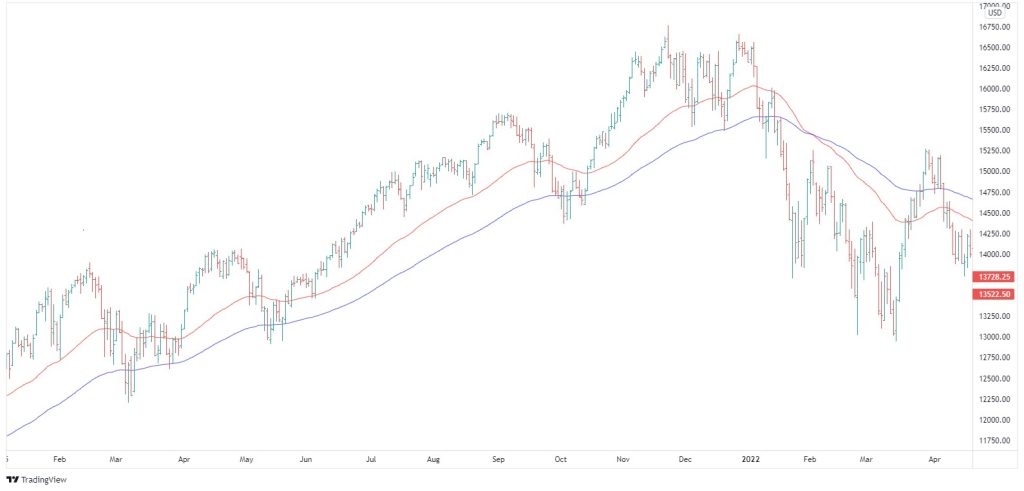
The first thing you notice with the Nasdaq is that it continues to lag the S&P 500, and I think it remains vulnerable simply because it’s trading below its 50 and the 100-day moving averages. I believe that add some vulnerability to the market, and I don’t want to be buying here. I don’t want to be pre-empting a low. I think that’s a risky play.
Whilst I think the potential for a rebound is on the table, I don’t like buying stocks or indices when they’re below these moving averages. I think it increases your risk of a blind side… of something happening and a sharp move going against you.
But I equally don’t want to be selling here because of those factors I was talking about. So, if anything, I’m just going to be neutral. I’m neutral on the U.S. market at that point but with that slight bias to getting some sort of rebound to the upside.
When I look at this, I think this market does look stretched to the downside. It feels a bit like a rubber band that’s been pulled back, and it does want to release in the opposite direction. I’m also mindful of a potential head and shoulders formation. If we saw a re-test of the neckline and an upward break, that’s how the Nasdaq could test higher levels. It doesn’t mean prices would continue to follow through on the upside, but that’s what a head and shoulders pattern could do.
And the sort of psychology… the sort of market mindset that I’m seeing and reading about at the moment, it very much fits the personality of the right shoulder of the head and shoulders. This is where the market starts to fall away, with people remaining sceptical, remaining bearish, and expecting lower levels, expecting a new low beneath the patterns head. And when that doesn’t happen, the market then reverses course, and those who are short cover, those who want to buy the early, start coming in, and it fuels an upward move.
That’s the theory behind the head and shoulders. They don’t always work. I’d find they’re not the most reliable of the patterns, but they can be useful. The market could just continue to fall away from here. While that’s not my base case, it’s always a possibility. I’m favouring that we are going to hold and that we do rally. But I don’t think this is a great tradable opportunity. I think it’s one to probably sit and watch.
Let’s take a look at the European stock markets:
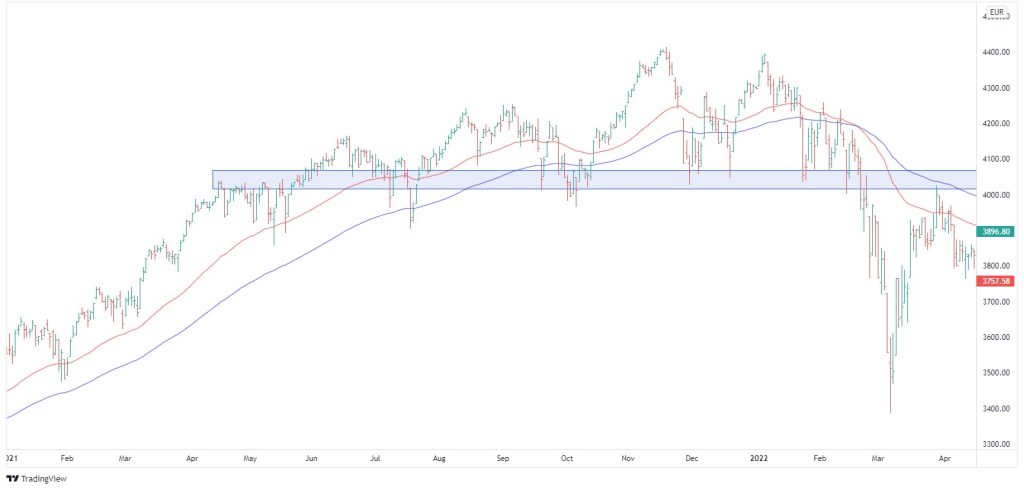
This is the Euro Stoxx 50. It contains some of the biggest stocks in Europe. And it’s another market that I’m neutral on. Maybe we’re starting to form a base here. You could very much come up with a case that this is some sort of a basing pattern and that we ultimately push higher.
But for me, the Stoxx 50 is below the 50 and 100-day moving averages. It’s also below a heavy resistance band around 4,050. So to me, it doesn’t seem like an asymmetric trade. It doesn’t stack up to be buying so close to the underside of a resistance band.
What if prices don’t stabilize and then punch higher? What if the Stoxx 50 starts to roll over? The risk-reward just doesn’t suit me. It could move higher, but this is a market which I’d rather pass on. I think there’s better opportunities elsewhere at the moment.
Looking at the German DAX index, it’s a similar sort of pattern. We’ve got the overhead resistance around 14,800, and it’s below the 50 and 100-day moving averages. I’d rather wait and see for now.
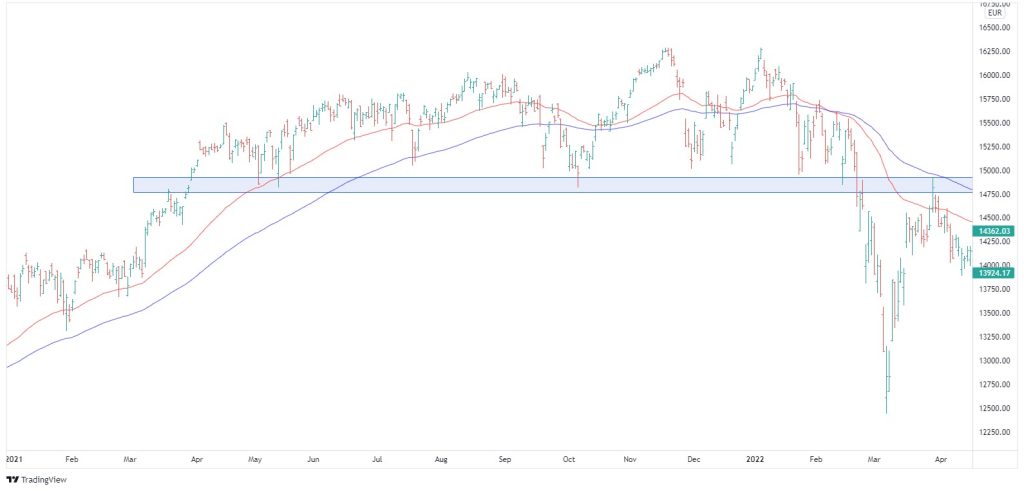
That said, though, it is interesting in that what we’re seeing a similar set-up to the Covid lows (see video). So there is a pathway higher for this market, but it always comes back to risk versus reward. Is the reward great enough to make the risk worth taking? Either way, you cut it… this isn’t a market for me at the moment.
Moving to the Australian market, the ASX 200, which is looking interesting as well.
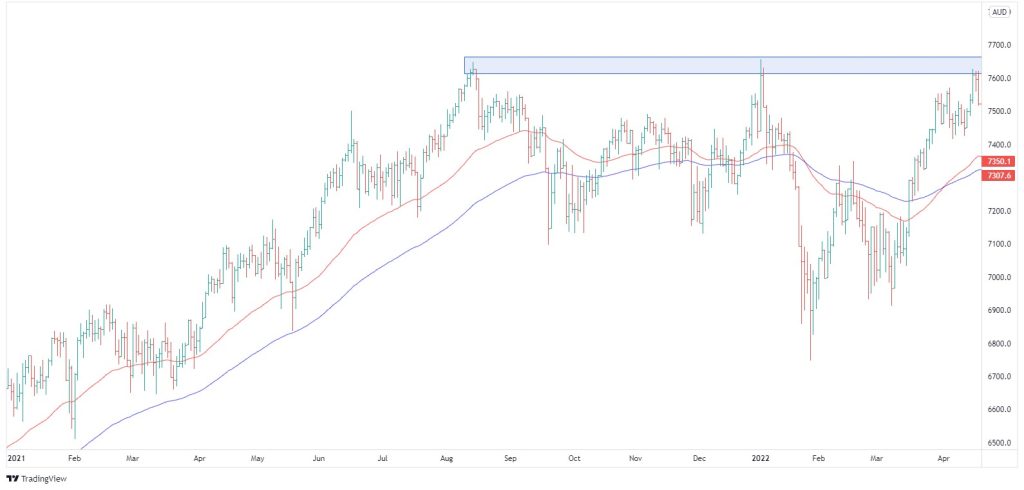
The ASX 200 has had another constructive week. It’s tested double top resistance at around 7,600 earlier in the week and is currently pulling back. The ASX 200 now appears that it could have a triple top at 7,600. Although, it’s too early to say that.
I think what’s most likely to happen is that maybe the market just needs to continue to coil up underneath this resistance band before it can push higher. My base case is that we see the ASX 200 break to a new all-time high in the weeks ahead. Time will tell. A pause would just give the moving averages a chance to catch up. But it does look good.
So unlike the European and the U.S. markets, the ASX 200 is above those 50 and 100-day moving averages. Structurally, it’s one of the strongest markets in the developed world at the moment.
I’ve remained long, and I’m still long Australian stocks. I’ve stayed long through the volatility and sell-offs of the past eight months. Of course, I’ve lost some stocks along the way… stocks which have hit their trailing stops. But I’m still holding other stocks that I’ve had since late 2000. I use wide trailing stops, so they’ve been able to see off this moderate bout of volatility, at least so far. I’m staying with those long-established trends, and that’s what’s giving my portfolio its outperformance.
So far, this is corrective period has been manageable for an investor with the right trading strategies. And I believe that the big broader trend remains upwards in the ASX 200.
Where to invest now
Looking for the best ASX stocks to buy now, as well as off the radar ideas most people don’t know? Our algorithms scan the stock market daily for medium term investment trends. We then tell our members precisely when to buy shares. And most importantly, we tell them when to sell.
If you’re ready to get started, try a no obligation FREE 14-day trial of Motion Trader, and see what an algorithmic trading approach could do for you.
Meet Jason

I'm Jason McIntosh, the creator of Motion Trader. My career began in 1991 on the trading floor at Bankers Trust. Nowadays, I trade my own systems from home in Sydney.
Motion Trader is for investors who value robust analysis, data driven entry and exit signals, commentary, and education. I use engineered algorithms to identify when to buy and sell ASX stocks. No biases or guesswork, just data driven signals.