Trade the Trend | Episode 36
By Jason McIntosh | Published 15 April 2022
Trade the Trend is a weekly video focusing on where the stock market is going. It’s for investors and traders looking for insights to the market’s next move. Jason uses technical analysis of stocks and trend following techniques to help you piece together the world’s biggest puzzle.
Where is the Stock Market Going?
00:00 Intro
00:21 Where is the S&P 500 going?
08:55 Where is the Nasdaq going?
12:18 Where is the Russell 2000 going?
16:18 Where is the ASX 200 going
19:44 Is Boss Energy (ASX:BOS) a stock to buy now?
21:43 Is Evolution Mining (ASX:EVN) a stock to buy now?
22:49 Can you spot the pattern in the ASX Gold Index?
25:17 ASX Gold Index vs All Ordinaries
Looking for the best ASX stocks to buy now?
Motion Trader‘s algorithms scan more than 2,000 ASX stocks daily in search of medium term investment trends. We then tell our members precisely when to buy shares. And most importantly, we tell them when to sell.
Try a no obligation FREE 14-day trial of Motion Trader, and see what an algorithmic trading approach could do for you.
Transcript
Please note: Charts available from video
Welcome to this week’s edition of “Trade the Trend,” a weekly video discussing where the stock market is going. I’m Jason McIntosh. It is Friday, the 15th of April, 2022. As always, this is a general commentary and doesn’t take your personal situation into account.
It’s been a fairly uneventful week for the S&P 500. We’re continued to see the market pull back over the last few days. And what it’s been doing is correcting the big rally from a few weeks earlier.
I think much of that rally was about short covering. The market got oversold and there was a lot of negativity… there was a lot of hedging… a lot of short positioning for further falls. This is typical of what we see when a market gets overextended in one direction. It then snaps back in the other direction. That’s what we’ve been seeing.
You might remember a couple of weeks ago, I showed you a chart of the number of S&P 500 stocks which were trading above their 20-day moving average. It was up at around 91%, 92%, which is quite extraordinary, because the market only gets there about once every or two. But when it does get up there, it doesn’t stay there for very long. And sure enough, that was the case this time. It’s now back to 43% of stocks above their 20-day moving averages.
So, it’s a really good indicator to keep an eye on for trying to spot those short-term extremes. It works on the downside as well. You can see once it gets below around 10% of stocks above their moving average, it typically is a sign that the market is near at least some sort of a pivot low. It doesn’t mean the market has bottomed completely, but you often get some sort of rebound and some sort of unwinding of an over-extended position.
I spoke about the potential for a 5% pullback in the S&P 500, and we’re smack on the 5% pullback now, so that’s pretty much all gone to plan. But I think the easier part… well, probably I shouldn’t say easy, but the more predictable part of this rally and then the pullback is behind us, and I think it gets a lot harder from here.
The difficult part of all this is that I think we’re in the part of the cycle where there’s just no dominant medium-term trend, and I think there’s a strong possibility the S&P 500 is going to trade back and forth within an extended trading range.
My view is that the S&P 500 is now correcting the entire advance from the Covid lows. And if that’s the case, it’s probably going to take time to do that. One of the possibilities is that it forms an extended range over several months. As always, this isn’t a forecast, we’ve simply looking for possibilities.
My favoured case has been that the S&P 500 rallies from current levels… maybe forming a double top near the January high, or just below there. And then from there, maybe the market we get a re-test of the lows towards the middle of the year. That’s one possibly. That’s my preferred case.
But maybe it doesn’t go like that. Maybe this market is going to continue to weaken off from where we are now. Maybe it is going to continue back down, and we’re going to get this retest sooner. We don’t know. We just have to see how it plays out and address the price action as it comes.
And, of course, it could do something completely different. These are just possibilities… and the more prepared you are for possibilities, the better you are able to manage them.
As I always say, my way of managing these markets is buy with the trend, hold position while those trends are intact, give them lots of room to move with wide trailing stops, so you can see off these bouts of volatility which we’re currently experiencing.
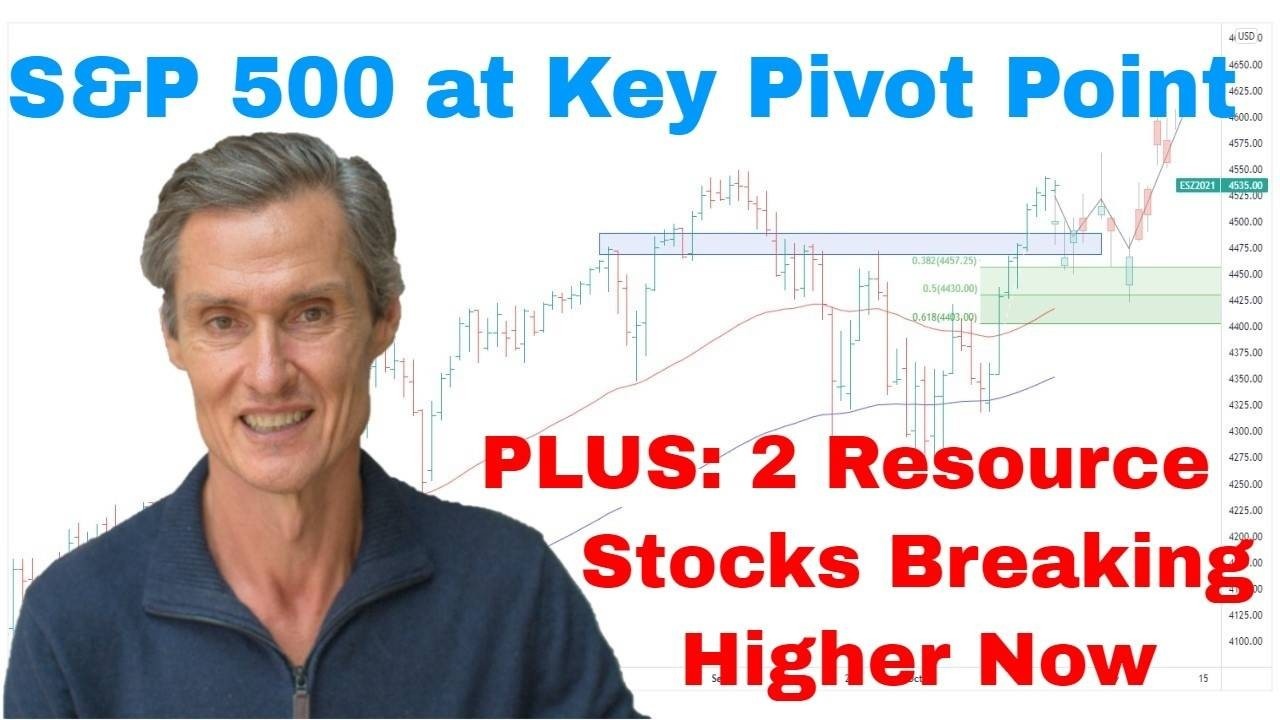
Let’s jump to a four-hourly chart, and let’s just focus in on the recent price action. The four-hourly charts are good at giving more detail that you see on a daily chart.
I’m going to add the Fibonacci retracement levels, and we’re just going to measure out from the recent low to the high. And when we do that, you can see the market is right here at the 50% retracement. This has been a pretty textbook pullback so far, in that it’s been a big rally and then a mean reverting pullback to the 50% retracement.
If we’re going to get a bounce, and if the S&P 500 is going to get that next leg higher, which I still think is possible, it should kick in now. A rally towards 4,600, which is this previous high, or even up to 4,800 is possible. If that were to happen, I think it really needs to engage now. We’ve got to see the buyers come in and start supporting the market here, buying this dip, and pushing it higher. That’s still my base case, but it really does need to engage.
Overall, I don’t think we have the backdrop for a new bull market in U.S. stocks at this point. The S&P 500 looks structurally okay. It looks like it needs to pause… needs to work build out an extended consolidation. But it does structurally appear okay.
That said, I do think we are in that part of the cycle where it is still going to take time. And I think a lot of investors are going to find this quite frustrating, in that we’re going to have some stocks rising, a lot of stocks just trading sideways, range-bound, and others which are going to be falling. It’s going to be a tricky time, I think. And this could play out for several months, into the middle of the year, or even beyond.
I’ll show you why I think this is going to take a bit of time. The S&P 500 is only about 9% off the all-time highs. That’s not too far. But the Nasdaq is quite a different story, because it’s close to 20% off its all-time. The Nasdaq also looks structurally weaker than the S&P 500, and I think it’s going to take time, because again, I think we’re correcting the whole move from the Covid lows.
We don’t know the pathway the market is going to take. It’s going to need to stabilize at some point. We could get a rally and then a retest of the lows later in the year. It could take any number of pathways, but I think the big thing is it’s going to take time to work its way through.
If we can put some Fibonaccis on the Nasdaq chart, it’s currently trading near the 61.8% retracement. So, again, this is one of those situations where if we’re going to get some sort of an upward reaction, it really needs to get going. The buy-on-dip traders need to come in, support the market, give it a push to the upside.
If you’ve got a keen chart eye, it will be interesting whether you’ve spotted a certain pattern on the Nasdaq chart. Just draw that neckline in there, and you have the makings of a head-and-shoulders bottom. This could be right shoulder being formed now, and then you have the head and left shoulder.
The theory with this would be if the market can start to get some upward momentum, it could get back to the neckline and then punch through. So, that’s a possibility. That’s a possibility that we are forming a bit of a head and shoulders bottom there, but I don’t think this is a sort of head and shoulders which is going to propel us to a new all-time, because, again, I think it’s going to take time.
But it is interesting to see head and shoulders structure start to form. It’s a sign that the Nasdaq may struggle to pick up downward momentum from here. This is where the head and shoulders works, in that the right shoulder doesn’t continue the momentum which we had at the head. The market then rebounds in the other direction. That would support that case that we get a retest towards the highs, and then, maybe from there, further weakness in the second half of the year. We’ll need to see how the price action plays out.
But, again, as I keep saying, I think this is a tricky part of the cycle. It’s a harder time to make money, and it’s a time where you want to be careful with your capital. It’s a case of, trade the signals which look good, which appear to offer good risk and reward. But don’t be in a hurry to take marginal trades, because this is where you can easily lose money as markets chop in these ranges.
I want to also analyse the Russell 2000, because its chart structure tells an interesting story. It’s another clue that upside potential in the U.S. markets could be limited over the next few months.
The Russell 2000 is an index of small-to-midcap stocks. The size of the companies ranges from something like, $200 million through to about $2 billion. And they make up much of your middle America stock. I see the index as a a barometer for the U.S. economy in general, because you’ve got all those rank-and-file stocks which make up so much of the economy.
Let’s put some moving averages on the chart… I’m using 50 and the 100-day moving averages. And what really strikes me about this chart is that you can see the moving averages have crossed and turned lower, and the price is currently trading below both the 50 and the 100-day, so that’s a vulnerable position.
A market is always vulnerable when it’s below those moving averages, and this is where the bad stuff can happen. It doesn’t always happen, so it’s not to say something bad is going to happen. But this is where stocks, or a market, is vulnerable to the downside. So, we need to be mindful of that, and it’s another reason why it doesn’t look like the S&P 500, to me, is going to be charging off to new highs anytime soon.
And another thing which is worth noting is this big resistance band around 2,100. It picks up all a big cross section of lows, so this was a big support band until when the market broke down in January, and now it becomes resistance. The Russell 2000 is really being pinning down by this resistance band. And whilst it’s below there, the Russell is vulnerable.
Now, I’m not suggesting the Russell 2000 is going to crash. But we could see further downside. And if we’re seeing downside in the middle America stock, it doesn’t make sense to me that we’d be seeing the S&P 500 surging. It’s largely made up of those mega-cap stocks, like Apple, which are, at the moment, really holding it up.
So, I think for the U.S. markets, the best case is that we see an extended consolidation, at least until we see signs that the Nasdaq and the Russell have started to base, and started to turn higher. That’s inevitably going to happen, but we just don’t know when. So let’s just keep watching the charts to give us an idea of when there could be, and we can maintain defensive positions in our stocks whilst we’re going through this period of consolidation.
And remember, a stock market consolidation is normal… it’s healthy for markets to pause, and it’s all part and parcel of the game.
Let’s jump to the ASX 200.
This is quite a different picture to what we’re seeing in the U.S., because the ASX 200 looks structurally strong. The dominant pattern is a double top resistance, at around 7,600. And the market really seems to be setting itself up for new all-time highs, which is in stark contrast to what we’re seeing in the U.S.
Often, I’ve seen this sort of pattern resolve to the upside. The price action coils up below the double top and then punches higher. That is a setup which I’ve seen so many times in markets.
Now, it doesn’t guarantee it’s going to happen. The market could, of course, do something different. Maybe it stalls here and starts to roll over again. You can’t discount that that’s going to happen. But at the moment, my base case would be, even though it’s against the grain of what we’re seeing in the U.S., is that the ASX 200 is going to punch to new all-time highs.
It may be hard to envision that the Aussie market does its own thing, but you never know. I’m all about being guided by the price action, not by opinion and biases about what could be happening. It’s a case of follow the price action and let that guide your decisions. And sometimes, you look back, after following the price action, and go, “Wow. I didn’t see that coming… look where I am now because I got on a trend and let it run.” So, that’s the way I trade these markets… just go with the price action.
One scenario is that we’re entering a period where the ASX 200 outperforms. It’s happened in the past. Last time it really happened was during the 2000s, say, between 2000 and 2007. We could be entering another period like that now. Time will tell. We’ll see how that plays out.
And just one other thing, which is really interesting. My Motion Trader service gave about a dozen new buy signals yesterday, for Tuesday’s open. And most of those signals were for resource stocks, which is interesting itself, because that could be the fundamental thing which is going to drive the Aussie market.
It’s so interesting… some of the names I’d never heard of before, and that’s often the case. It’s one of the amazing things about using algorithms to can a market of 2000-odd stocks… some of the best opportunities are in the stocks that almost nobody knows. Well, nobody knows yet, until they become boom stocks, but over the next 12 or 24 months. So, who knows whether they’re in yesterday’s signals, but that’s how I come up with these names which I’ve never heard of, by doing these algorithmic scans.
Where to invest now
Looking for the best ASX stocks to buy now, as well as off the radar ideas most people don’t know? Our algorithms scan the stock market daily for medium term investment trends. We then tell our members precisely when to buy shares. And most importantly, we tell them when to sell.
If you’re ready to get started, try a no obligation FREE 14-day trial of Motion Trader, and see what an algorithmic trading approach could do for you.
Meet Jason

I'm Jason McIntosh, the creator of Motion Trader. My career began in 1991 on the trading floor at Bankers Trust. Nowadays, I trade my own systems from home in Sydney.
Motion Trader is for investors who value robust analysis, data driven entry and exit signals, commentary, and education. I use engineered algorithms to identify when to buy and sell ASX stocks. No biases or guesswork, just data driven signals.