Trade the Trend | Episode 33
By Jason McIntosh | Published 25 March 2022
Trade the Trend is a weekly video focusing on where the stock market is going. It’s for investors and traders looking for insights to the market’s next move. Jason uses technical analysis and trend following techniques to help you piece together the world’s biggest puzzle.
Where is the Stock Market Going?
00:00 Intro
00:21 Where is the S&P 500 going?
16:05 Where is the ASX 200 going?
19:14 How I use trailing stops
21:42 Where is gold going?
Looking for a free stock market training course?
Learn how to identify some of the best stocks to buy now in this free video training. You’ll learn a complete stock trading strategy for buying and selling shares with confidence. We’ll also share real life examples to help you apply the knowledge and build a profitable share portfolio.
Where to invest now?
Looking for ASX stocks to buy now, as well as off the radar ideas most people don’t know? Our algorithms scan the stock market daily for medium term investment trends. We then tell our members precisely when to buy shares. And most importantly, we tell them when to sell.
If you’re ready to get started, try a no obligation 14-day trial of Motion Trader, and see what an algorithmic trading approach could do for you.
Transcript
Please note: Charts available from video
Welcome to this week’s edition of “Trade the Trend,” a weekly video discussing where the stock market is going. I’m Jason McIntosh. It is Friday, the 25th of March, 2022. As always, this is a general commentary and doesn’t take your personal situation into account.
All right. With all that said, over to our first chart. Well, we’ve got the S&P 500 on the screen here and, well, it hasn’t been an interesting week despite all the bad news that’s been thrown at this market. It’s actually rallied. We’ve had a good rally over the past seven days adding to the rally we had over a few days before that. So, look, we’ve got war, inflation, we’ve got rate hikes in there. There’s been pretty much something for every bear in terms of throwing the bad news at the market. But, look, as we know, the market didn’t go down. It’s gone up.
So, what I’d like to do now, let’s jump over to the four-hourly chart. As, you know, the four-hourly charts are great at getting the details within these individual bars to get a closer look at the price action. And when we do this, we go over to these four-hourly bars, very interesting. Like, what we’ve got here, just up through this section here, you know, this is what a short-covering rally looks like. So, we’ve talked about this bullish wedge formation over the last few weeks, which we saw developing I think a couple of weeks ago, and then we talked about the possibility of it being there, then we got the breakout. Look, think that maybe the breakout was a couple of weeks ago. And then this has all sparked this short-covering rally which we’ve continued to see up through here. So, you know, short-covering rallies. This is what they’re all about. And, look, we’ve been talking about this for a few weeks and it’s interesting because I know this setup so well.
So, just down here a couple of weeks ago, it looks probably more than a couple of weeks ago now. Look, no, maybe two, three weeks ago when everyone was so bearish. I know this situation because, like, I’ve been in the dealing room. I’ve been on the trading floor in these sort of environments when you got a market which appears very vulnerable, and it was very vulnerable, and so many traders are sitting short the market down at these levels, you know. They’ve gotten their shorts and I know what I used to do. I’d look for breakdown. I’d look for breakdown points maybe down through here or down through here. I’d get short, have a good trailing stop on it so I give the market plenty of room to move, add to my positions on the way down as so many of the traders do. And you find down around these key points the market gets very short. There are a lot of people sitting there waiting for the next leg lower, hoping for the next leg lower to make a lot of money. The market often doesn’t deliver those big windfalls. In fact, what you often see is what we’ve actually seen in recent times. We’ve seen the short-covering rallying, the market reverses takes out a lot of those shorts.
So, the question now is where to from here? Where is this market going to go next? And now, I think the key thing to know is that we actually don’t need to know. We don’t need to know exactly what’s going to happen next. It’s all about having a strategy that’s really going to help us deal with whatever happens next. And I think if you got a good exit strategy, this is the first really important thing to understand at these points. If you got a good exit strategy, so for me, it’s one that uses a wide trailing stop. That’s what I’m using myself. That’s what I’m using through my Motion Trader subscription service. And if you’re using those wide trailing stops, then chances are…we should duck over to the daily chart. Using those wide trailing stops, chances are you’ve been able to see off a lot of this volatility so far.
And I know with my own portfolio, I had been exiting stocks over the last few weeks during this period as the trailing stops have been hit, but the majority of my portfolio is still intact. I’ve been able to see off this correction so far. Now, we don’t what the future is going to bring. Maybe there’s going to be more volatility and take out a lot of my portfolio but, at the moment, a strategy of using wide trailing stops has been able to see off a lot of this volatility, a lot of this uncertainty and fear which we’ve seen in the markets. And, look, I think where we are now, I think there are several scenarios on the table.
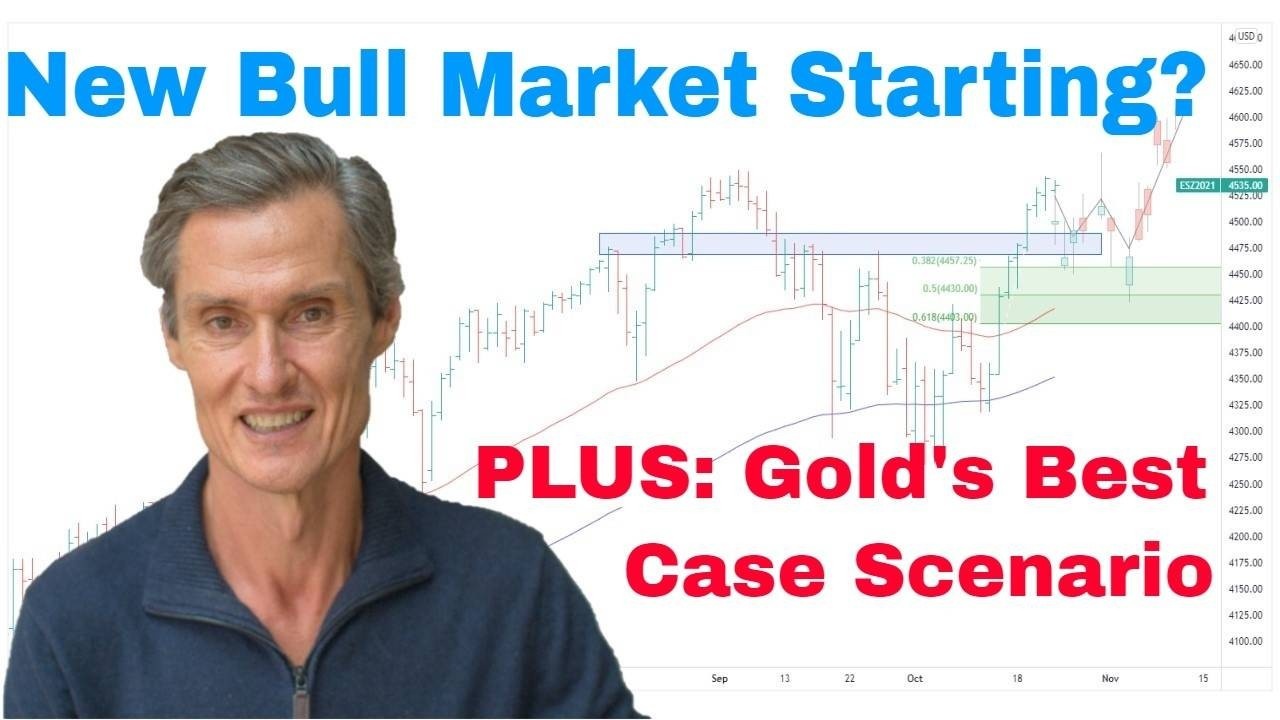
So, let’s go back to that four-hourly chart. And I think the best-case scenario would be that the market pauses somewhere, somewhere around here, maybe goes a touch higher, maybe it starts to consolidate tonight but, you know, it starts to…you know, over the next couple of weeks, three weeks, starts to, you know, track sideways, finds good support. We want to see the market finding good support. We want buy on dip. We want those buy on dip traders coming in and supporting any pullback, you know, just putting some Fibonaccis on here to give us an idea. Like, you know, potentially, the market could come back into this zone in here and still remain, you know, structurally intact in terms of being able to put on further rally.
We want to stay well-supported over the next few days, next few weeks for that matter. And then from there, potentially, we would get like another leg higher, some more consolidation, and then higher again. I think that’s the best-case scenario for this market. What we want to see develop is we want to see this sequence of higher highs and higher lows. You know, that’s the natural state of a bullish market. That’s how markets advance and continue to advance over a period of time. And we also want to see the volatility continue to decline. So, we don’t want to see this sort of price action where we got, you know, the move up and then we got, you know, the sharp moves lower. Volatility is telltale sign of an unstable market. And we’ve been seeing that in the VIX index over the last week or so, seeing volatility come back. So, that’s encouraging but we want to see that continue.
And, look, you could say that the market actually has done its minimum in terms of a correction. So, if we go back to the daily chart, look, depends how you analyze this. Depends how you want to look at it. My feeling is that we are correcting this entire advance. We’ll get to this in a minute. And if we’re correcting this entire advance, there’s probably more in this yet but that may not be right. You know, you’ve always got to have your alternate scenario, got to understand the other possibilities on the table. The other possibility is that we’ve been correcting the move from this low here. So, we had an initial move higher. We had a consolidation. That was a considerable consolidation through there. Then we had another big rally over the period from around November 2020 through to the high point. So if we were correcting that part of the move, just putting the Fibonaccis on there, we’ve done enough to say that correction is over, which then does support the possibility that we get to see this sort of price action in a move to new high.
So, that scenario is on the table. And it’s possible that this bullish trend does reengage. So, it’s not my preferred scenario. Look, I’ve had to say either way what I thought would happen. It’s not my preferred scenario but I do think it’s possible. And if you got the right strategies in place, then I think it’s possible that you can position yourself for this scenario, even though you’re prepared for more volatility, look, in the weeks or potentially the months to come. And that’s why I say we don’t need to know what the market is going to do for sure. What’s it going to do next? We don’t need to be able to answer that with certainty. Of course, we can’t do that anyway but we don’t have to take a strong position one way or another because we got the right strategies we can handle either scenario. We can handle a scenario where the market rallies and go some new high or where the rally stalls and then comes back.
And so, I don’t want to put myself in either corner. I don’t want to put myself in either the bullish corner or the bearish corner because that’s what a lot of people do. And the problem when you do that, the problem when you get either…you know. You say, “Look, I’m dead set bullish on this market,” or, “I’m bearish and it’s got a fall.” When you do one or the other, you make it so likely that you end up wrong and just end up staying wrong for a long time and the market moves either way without you onboard or, you know, if you’re rock-solid bullish and the market is falling, you know, you stay in stocks for too long. So, you got to be flexible with how you approach and how you handle these situations. So, it’s a bit like, you know, we want to play the ball that’s delivered rather than play some preconceived idea of what should happen. So, that’s where your strategy is so important, having your strategy to go with the momentum when you got the momentum working to the upside but then having your exit strategies in place in case that momentum doesn’t continue.
And now, I want to go over the other scenario, the scenario which I’m very much mindful of at the moment with the U.S. market and also the Australian market and, look, some of the other big Western markets. What I’m mindful of is the zigzag correction where you get the first leg down then you get the B wave back up, so the zag. You get the zag higher before you get another zig lower. So, it’s possible that this rally we’re getting at the moment is all part of this B wave rally. So, you never know how high this goes. It could come up and almost, you know, retest the old high. It could pull up around 4,600, 4,700, and then in maybe a month or two or three’s time, perhaps as we start moving into the Northern hemisphere summer, we get another leg lower. So that’s what I’m very much mindful of now that we get this second part of a larger correction from those COVID lows.
And I just look at what the Fed’s been trying to do or what it is trying to do at the moment. So, they’re trying to rein in inflation. We know that, and they’re also trying to do so without scaring the market. They don’t want to get a situation like they had back in 2018. So, we just look at this period back in 2018 when the Fed was talking about they wanted to raise rates, wanted to pull back, you know, the quantitative easing programs and the market really took flight. It got a sharp move low. Fed doesn’t want this. Fed wants stability in the stock market. And so, this is why it’s a very, you know, precise balancing act they got to do at the moment, you know, to pull this off, to pull down inflation without spooking the market, and they don’t want. I don’t think they want to see this. I think the Fed would rather see the markets just track sideways for many months. Just take the steam out of things. And that’s what they’re probably trying to engineer with their rate height cycle. But we don’t know. We really got to be guided by the price action.
And so, I think my play here is to position for upside but have a plan to get out or to minimize risk should we start to see this sort of price action develop later on. I certainly wouldn’t be charging back into the markets around where we are at the moment and I wouldn’t be getting aggressively along with leverage. This could all just be short-covering. This may not be a whole lot of new buying at all, and it could peter out where we are now, get a bit higher. It could pull back, have another tilt at going up then pull off. But, you know, I think it’s a market we want to be very, very cautious of. Whilst having said that, we also don’t want to miss out should it continue to go higher. So we got to be flexible with our approach here.
And, look, if we look at the NASDAQ, just jump over to NASDAQ. Now, you can come up with that quite nice bullish scenario for the S&P 500. NASDAQ looks different again. It doesn’t look like a strong market. It’s further from its highs than the S&P 500, and it’s a market that looks like it needs to do a bit of work before you could consider, you know, it’s on its way off to new highs. So, look, I think we just need to be careful of this market whilst probably giving the benefit of the doubt to the current momentum that we’re seeing. Look, another possibility that we could see coming into these markets…just going back to the S&P 500, another possibility is we see a big range develop. We see the market become range-bound over many months, maybe over the rest of this year. It forms a big platform through here which then could either be a big topping formation that rolls over or provides a base for the next big advance upwards.
So, look, markets are always evolving. It’s not about having rigid viewpoints. It’s about spotting the possibilities and then using those tried and tested strategies to take advantage of them or to minimize your risk when they go the opposite way to what we’d like to see. And we were to see a big range. This is really where momentum strategies can really stand out because they can really help you identify what’s moving because during these big ranges, if that were to happen, you also get a lot of stocks which continue to perform well but they’re just fewer and further between. It’s not like the rising tide lifting of boats sort of mentality. And those momentum strategies can help you identify what’s moving and they can also help you avoid what’s sort of like stuck in the mud, what’s stuck in the range. So, it’s going to be interesting how this all continues to evolve and play out over the coming weeks.
And now, look, if you’re getting value from this, please hit that like button and please leave a short comment in the comment section just, “Hey Jason, like the video, thanks.” Just something really simple. It just tells YouTube that people are watching, people are engaging, then YouTube will show other people. And if, you know, people are watching, well, then I’ll keep making the videos. So, please do. That really helps.
And now let’s jump over and have a look at the ASX 200 because, look, also interesting things happening in my local market, and it’s been continuing. It’s been continuing. It’s run higher over the last week. And I think a big supporting factor for the ASX 200 during…look, pretty much over the last six weeks, it’s been the miners. It’s been the resource sector and it’s also been some of the value plays like the banks, which have held up quite well during this volatile period that we’ve had. Same thing has been happening in the Canadian market. It’s already at…I think it’s already just hit new all-time highs. So, there are markets which are doing well. Look at Europe, very different story. You know, the markets here are still quite weak and they don’t have any clear trend that you’d want to be getting involved with at the moment. They’re sort of like steer clear of markets. But there are ones which are doing well.
And, look, as I’ve been saying I think the strategy here is to give the bulls the benefit of the doubt. I think we want to go with this strength which has been developing and not second guess whether it’s about to top out and finish. Look, I still have my concerns that this market could decline over the next couple of months just as I do in the U.S. market, but we don’t know. We can let the price action guide us. Whilst the price action is rising, you know, if you’re holding stocks, it’s like, well, let that momentum go until you get a clear-cut signal that it’s time to get out. And it’s interesting. I’ve had some really interesting buy signals this week through my Motion Trader service which is identifying the momentum which is coming through in some of these stocks.
So, look, there are definitely opportunities out there but I think the key here, I think the big key is to look for upside exposure in the right stocks. And I’ve been talking about that over the last few weeks, and the right stocks for me are stocks which are trading above their moving averages. I’m looking at 50 and 100-day moving averages. I want to buy stocks which are trading above those moving averages. Maybe you pull back to the moving averages now starting to rebound. They’re all opportunities. It’s the ones which are below the moving averages which I want to steer clear of because I think they’re the ones where the most risk lies. And, you know, as I was saying earlier, if you’ve been using wide trailing stops with your portfolio, then it’s been possible to see off much of this volatility we’ve had in the ASX 200 since August.
So, look, I’m holding stocks which I bought back at this point still and this volatility hasn’t taken me out. They’re all in my Motion Trader subscription service portfolio as well. I calculate the trailing stops and, you know, it gives subscribers that clear-cut exit point, which I think is so important rather than trading off fear of what could happen of having that calculated exit point. I think it’s so important that you have a means of doing that during these periods. And I’ll show you what I mean. I’ve got an example. Just a quick example I’ll give you.
This is a stock in…well, it’s in my own personal portfolio. It’s also one of my Motion Trader stocks, which a lot of my subscribers would have. It’s an environmentally-orientated stock called Calix (CXL). What they do, they take CO2 emissions out of cement production and various other things. Really interesting stock. So, I’ve been in this for some time. So, just quickly going back where it all started. Moving averages across. I had that momentum which I’ve been talking about. Momentum to the upside. Got in here, set a wide trailing stop. So, I initially came back for a couple of months. Didn’t get to the trailing stop, and then the trends gotten underway.
And, look, I had people emailing me saying, “Look, why is your trailing stop so far below the share price? You know, why don’t we move it right underneath to protect our profits?” But, you know, thing is, like, it doesn’t necessarily look like it on this chart but these are some big swings the stock is doing. So, like, there’s 20% pullbacks in there but the volatility of the stock and the price scale makes it look a lot calmer than it actually is because when real volatility, big volatility comes in, the wide trailing stop, you know, comes into its own. So, despite this fall that we’ve had, I had and my subscribers had, we’ve been able to sit through this volatility and the stock’s up close to a new all-time high. Got really close here. These things don’t work with precision but, you know, sometimes you’ll click the stop and get you out. Other times it will, you know, just keep you in. But, you know, keeping those wide trailing stops give you every chance of staying in these longer-term trends. That’s what we’re trying to do at the moment. And so, look, I think there is good scope to continue to stay with some of these stocks, and if you got these right strategies, then I think that’s the way to play it.
So, look, now let’s just quickly…just to wrap this up, I just want to go over and have a quick look at gold because, look, gold is continuing to develop. And so, just look at this. Look, I think the best thing that can happen for gold at this point in time would be for it to go sideways for a few weeks. Just sort of like consolidate what we want to see. We want to see it being supported. We want to see buy the dip come in there and hold it at this level. If it can do that, then it provides a platform for another advance. I think, look, at the moment, it’s looking constructive. We got this breakout. I think we’ve got to continue to go with it. But I do think we do have the prospect of consolidation.
So, I just go over here and I look at GDX, the VanEck Gold Miners index. This is a U.S.-listed ETF. Just looking at the price action here. It looks like it’s like we have had a big run-up. We had the breakout of this big wedging pattern. Big run from the lows would pull back, but it looks like it needs to do more work. I think we may see this over the next few weeks start to pull back somewhat and maybe we do get, you know, some sort of a sideways sort of move, and then from there, it starts to move higher. Just putting some Fibonaccis on this, and yeah, look, I think we could see this pullback towards the 50%, sort of, pocket over the next few weeks. I don’t think there’s a hurry to go chasing those gold stocks. It’s very much on a case-to-case basis.
Look, I’ve had some good signals for a number of gold stocks over the last couple of weeks and this is just going to be…A lot of the local stocks, Australian stocks as well as the North American stocks. I think they’ve been setting up nicely. So, look, let’s just watch and wait and see what sort of signals we get and what sort of momentum we get. And it’s going to be interesting to see what comes up over the next few weeks. And there could be some good opportunities in that gold sector, so want to keep watching closely.
So, look, let’s call that a wrap for this week. Thank you for watching. Thanks for joining me again, and hopefully that’s helpful. Please hit that like button, and I look forward to coming back and joining you next week. Thank you.
Meet Jason

I'm Jason McIntosh, the creator of Motion Trader. My career began in 1991 on the trading floor at Bankers Trust. Nowadays, I trade my own systems from home in Sydney.
Motion Trader is for investors who value robust analysis, data driven entry and exit signals, commentary, and education. I use engineered algorithms to identify when to buy and sell ASX stocks. No biases or guesswork, just data driven signals.