Trade the Trend | Episode 32
By Jason McIntosh | Published 18 March 2022
Trade the Trend is a weekly video focusing on where the stock market is going. It’s for investors and traders looking for insights to the market’s next move. Jason uses technical analysis and trend following techniques to help you piece together the world’s biggest puzzle.
Where is the Stock Market Going?
00:00 Intro
00:21 Where is the S&P 500 going?
09:13 Where is the ASX 200 going?
12:25 Where is gold going?
21:28 Where is oil going?
21:46 Which energy stocks to buy?
Looking for a free stock market training course?
Learn how to identify some of the best stocks to buy now in this free video training. You’ll learn a complete stock trading strategy for buying and selling shares with confidence. We’ll also share real life examples to help you apply the knowledge and build a profitable share portfolio.
Where to invest now?
Looking for ASX stocks to buy now, as well as off the radar ideas most people don’t know? Our algorithms scan the stock market daily for medium term investment trends. We then tell our members precisely when to buy shares. And most importantly, we tell them when to sell.
If you’re ready to get started, try a no obligation 14-day trial of Motion Trader, and see what an algorithmic trading approach could do for you.
Transcript
Please note: Charts available from video
Welcome to this week’s edition of “Trade the Trend“. a weekly video discussing where the stock market is heading. I’m Jason McIntosh. It is Friday the 18th of March, 2022. As always, this is general commentary and doesn’t take your personal situation into account.
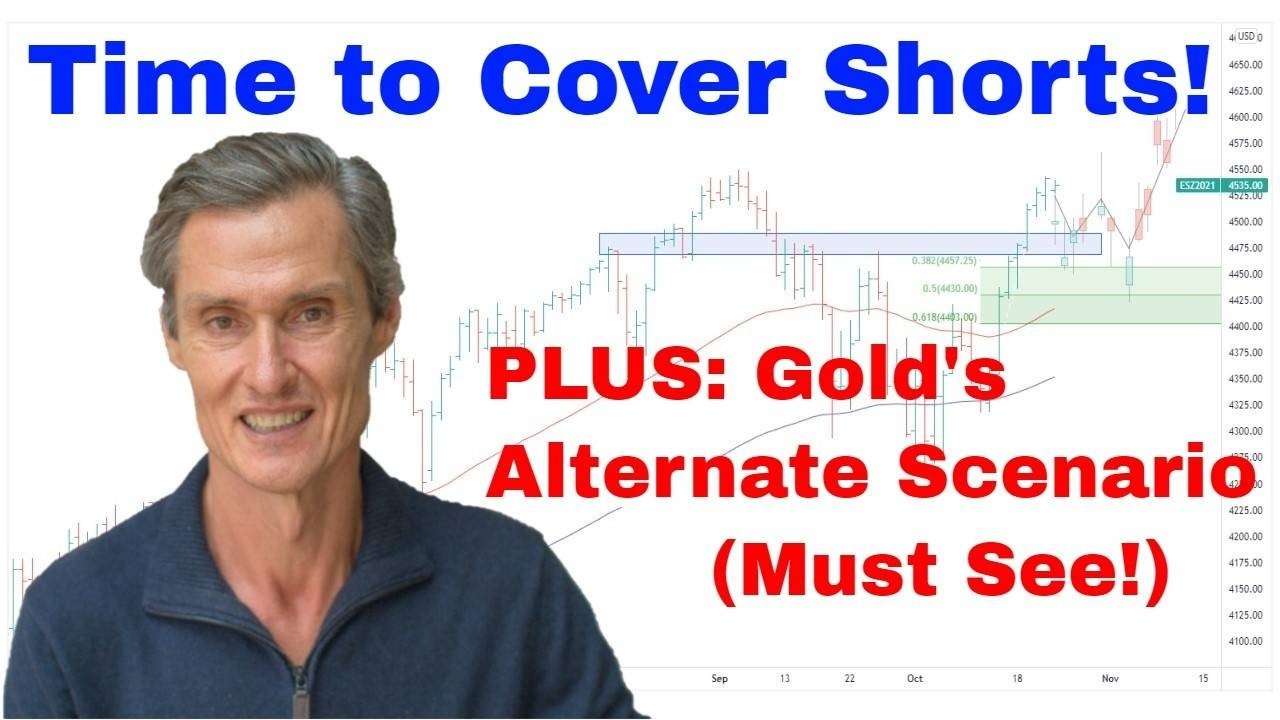
All righty. With that said, let’s get straight to our first chart. Okay. The S&P 500. Well, over the last couple of weeks, we’ve been talking about the potential for a short-covering rally. So, what we’ve been seeing is the markets trading around down here over the last month. There’s been a lot of volume going through some of those hedging instruments like the bear market ETFs, the inverse ETFs, put buying, there’s been a lot of short interest. So, we’ve been talking about that potential for a short-covering rally. And I think we’ve now got some signs that that could be getting underway with what we’ve been seeing over the last few days.
So we’ve had the Fed come out and hike rates during the week. They’ve been pretty hawkish about what they’re looking at for the rate hike cycle. And I think it surprised a lot of people that the market has come out and has rallied on the back of that. And it’s so often what we see, because the market gets itself so worked up and so positioned for something that they’re expecting to happen. And often, when that happens, the market will then reverse course. And that’s very much what we saw last week.
And it’s a really interesting chart structure when we look at this. So, what I want to look at a four-hourly chart. We spend a lot of time looking at the daily charts, and daily charts are fantastic. But it’s also good to be able to step back and get down into some of those intraday charts, like a four-hourly or even an hourly chart, just to see the internal structure, because you get a little bit more detail and it can help you see patterns and help you see potential setups that you might otherwise miss.
Now, there are a couple of key areas I want to talk about. So, first up, is this bullish wedge formation, which we spoke about last week. So let’s just have another look at it now. These formations, they often appear near market bottoms. And what happens is you get this contracting price action, the market exhausts itself to the downside and then turns and breaks upwards. And that’s what we’ve seen over the last couple of days. We’ve got a breakout from this bullish wedge formation.
Now, I just want to be clear about one thing though, I’m not turning bullish on this market. I think, like, if you’ve been listening and watching over the last couple of weeks, I’ve been talking about this correction potentially playing out over the next few months. But what I think we might have here, I think we might have a situation where the immediate vulnerability has passed and now we’re about to get some sort of reaction to the upside. And then if this happens, I think we’ve always got to be mindful that it could take a few months to play out. If we get a rally, we could then get the second act of a larger decline in a few months’ time.
That’s getting ahead of ourselves. Let’s just look at where we are now and the potential for what happens over the next few weeks. And one of the reasons I think this short-covering rally could be starting to engage is that, you just think about everything that’s been thrown at the market over the past few weeks. We’ve had big inflation numbers coming out of the U.S., like inflation at 40-year highs. Interest rates have gone up this week. And bond yields have been rising over the last few weeks. There’s all the geopolitical trouble. We’ve got a war going on over in Ukraine. Oil spiked up towards $130 a barrel. And we’ve also seen all these other key commodities spike higher too. So, that adds to inflation. So you’ve got all this stuff going on, yet the stock market hasn’t melted down like a lot of people thought it was about to. It’s had like three tests at really cracking down towards this 4,000 level and below, but hasn’t been able to do it, and now we’re getting a rebound. So, I think the path of least resistance, at least in the near term, is probably setting up for higher.
Now, I think the first test of this view, which I’m talking about, is to see, look, can the market hold this break? And we’re gonna find that out over the next few days. And then the next thing will be, can it break above a resistance band? So, I’m just gonna put some resistance on this chart. It goes somewhere, like, just looking at a line of best fit, it’s something like that. It’s around, say, 4,420 to 4,440, thereabouts. Got a resistance band, picks up some work through here, here, bit of work through here, touches going there. And we’re just butting our head…the market’s butting its head up against it right now. So, this is a key moment to see what the market is gonna do, because, look, you know, there’s always alternate scenarios. If this short-covering doesn’t engage and we get a quick move back down, the market could set itself up and reengage into a sales cycle. That’s still on the table. This is by no means, you know, the market is going up. We’ve got to be aware of everything that could happen. So, that’s still a possibility.
My preferred case, at this stage, I think we’re gonna see something like this. I think, whether we pull back tonight, or we go up tonight, I don’t know. But I think if we can do this, if the market can get its nose above this resistance band, then it really sets the stage for being able to go higher. And, yeah, see some more short covering come in over the next, probably over the next several weeks.
Look, and if we do get some meaningful unwinding of these positions, I think there’s a potential to see this market rally maybe 5% to 10% from where we currently are. So, look, we’re here at the moment. A 5% rally would get us up to around here, around the top of this pattern. Ten percent gets us up towards the previous highs. So, somewhere within that band is a possibility for a big short-covering or hedge unwinding type of rally. But look, as I’ve said, I don’t think this is a case of, go out there and buy everything moment on the basis of what could happen in that respect. Because, look, I look at markets like the NASDAQ. And I’m just gonna jump back to the daily chart for a sec on this. And look, the wedge doesn’t really appear so well on this, it’s very elongated. I wouldn’t call this a bullish wedge. The bounce it had off the low is quite soft.
NASDAQ’s not looking bullish, it certainly has potential to rally in a short-covering rally type scenario. But I’m not about to say, “Look, this market is turning bullish and we’re off to new all-time highs,” by any stretch, not at this moment. So, it’s a case of…yeah, look, I think we could see some upside, but I’m still mindful of whether this big A, B, C zigzag could play out over the next few months. That’s the sort of scenario which I think we could see. I don’t know crystal ball sort of stuff, you know, coming up with how a correction is going to play out, but this is of course, this is your classic corrective sort of setup.
You get the first leg down, you get the move up, sort of like suckers people back into the market thinking, “Oh, we’re back to new all-time highs.” The bull market is back engaged, and then it rolls down, it goes and makes a new low. Whether that plays out, time will tell. That’s very much a scenario which is front and centre in my mind at the moment. Look, let’s see how the next week plays out, whether we can, in fact, get above here, give us some more clues as to what’s going on.
Let’s quickly jump over to the ASX 200, the local market. And this is looking encouraging. Last week we talked about… Look, I said, look, the market has got to hold these lows. If it breaks those lows, well, it opens up the window for another no-selling event, which could take the market quite a bit lower. But, look, it didn’t even challenge it. We’ve seen the market punch back up towards its highs from February. And if we do a measured move, what you can do, you can do a measured move. So, a measured move is using a previous low, going up to sort of like, we call it a swing high. Coming back down to the low point for the reaction down from that high, and then you project that higher. That gives us like targets up around 75 25, which is about, you know, 3% to 4% above where the market is now.
So, look, there’s… And that’s not as far as the market…look, the market…we don’t know. We don’t know. The market could come up, it could retest these highs up here. The local market does look like one of the best markets from the developed market suite of indices. It’s the ASX 200 and the Canadian market, probably two of the standouts. And that’s not surprisingly due to their concentration of resource-based stocks. And also the banking stocks in both markets have been doing quite well, and they’ve been really underpinning both of those markets, which we’re not seeing in other developed markets, like Japan, for instance, doesn’t have that resource sector and its been having some heavy selling. And, of course, Europe is in another situation altogether.
So, for now, I think we look for continued strength over the next few weeks, but we just sort of always keep monitoring. And again, I don’t think it’s a buy moment, everything. I think it’s a case of being very selective about what you get into, it’s looking for stocks above their moving averages. It’s not about buying those falling market favorites that have done so well over the last two years, because quite often, you find that the leadership changes during these big corrective periods. And when we come out the other side, it may not be tech leading the charge anymore. So going out and buying your favorite tech stock which has been hit pretty hard over the last couple of months, it may not be the play coming out of this and going into the next upcycle, whenever that should happen.
And so, now, let’s go over and have a look at gold now. And just firstly, before we get to that, if you’re getting some value from these videos, please hit that like button and maybe even please leave a short comment, because that’s really helpful too because it tells YouTube people are engaging with the videos, YouTube then shows more people, more people watch, and I keep making those videos. So, please give me that like, please give me a short comment, even if it’s just, “Hey. Like the videos. Thanks.” It really helps. So, please do that.
So, over to gold. And okay, so, gold. So last week we spoke about not chasing gold higher. And this is exactly why I don’t like chasing gold stocks higher. Because I spoke about last week, about like, we’re so extended up here above the moving averages. And I’m using, of course, 50 and 100-day moving averages. And I said something along the lines, you know, the moving averages are a bit like gravity to a stock price. And when the market gets so far above those moving averages, it’s like the moving average is a gravity, it pulls it back down. And that’s what we’ve seen in gold. Look, I think we’re gonna learn a lot in the next, oh, look, the next one, two, three weeks, the next few weeks. I think we’re gonna learn a lot about what’s going on with this market.
So, what we wanna see happen now, we wanna see the buy-the-dip traders and investors come in and really start to support the price down through this region here, around that, you know, that 1,880, 1,870 sort of level. Because, as you probably heard me say a week or two ago, I said, look, my concern with this market is that this move has been very catalyst-driven, has been all about what’s been happening in, I think mostly that what’s been happening in Ukraine. And catalyst breakouts aren’t my favorite breakouts. I like breakouts when you’re kinda wondering, why is it breaking out? And then you figure it out later on. It’s very obvious what the catalyst for this breakout is. So, that’s why I think it’s so important that the market finds support down around this sort of region here, and we start seeing some buying interest coming in.
So, I wanna go through a couple of scenarios about how gold could play out. So, let’s just… Yeah. So let’s just set this up. So, what we have at the moment, we’ve got, we can say at the moment, we’ve pretty much got a double top. We’ve got the high from July, 2020, we’ve got the current high, we got a double top. Now, that’s not necessarily a bad thing. This can be good because what a market will often do, a market will often come up, it will hit the point from the previous high, make that double top. And then you’ll often find that it consolidates below the top, and then it starts to come up and have another crack at it, and then it’s often away. That’s often what you see around these double tops. And I think that would be the best-case scenario for gold, if we saw something like that. We see it well-supported over the next few weeks, maybe the next few months, maybe this takes six months to play out, who knows? We see it well-supported. It builds a new underlying base, and then it starts to punch higher. That would be the best-case scenario.
I’ll just give you a quick example of a recent pattern where something like that’s happened. We’re seeing something similar in uranium. I’ll just get rid of that for now. So, we’re seeing similar in uranium. We had the big punch higher, then we got the consolidation, and now we’re having like another punch higher. So, you know, quite normal for a market to surge, come back, you know, gravity pulls it back to those moving averages, consolidates, and then goes again. So, you know, markets don’t do a template of a previous move every time, but it’s the sort of setup which I’d like to see in gold. I’d like to see this sort of pattern develop and then we get out and move higher.
The danger, I think, you know, the danger. Let’s go through a bearish alternate. And, you know, some people don’t like alternates, they say, “Oh, look, you just don’t know what’s gonna happen because you told us two views.” But that’s not right. People who say, they don’t really get it, because it’s about identifying your possibilities and then coming up with the strategies to manage those possibilities. So you’ve got to be aware of alternates, you’ve got to understand where you could be wrong. If you don’t know where you could be wrong, well, how do you manage that possibility? So, that’s the whole point of these alternates.
Now, there’s also a possibility that…now we’re saying that this is a catalyst-driven break. So the way with the catalyst-driven break is, say things settle down in Ukraine. By some miracle, things start to simmer down and we start to normalize, and then we get a case where gold starts to lose its momentum and pulls back within the range, and we start getting liquidation. People who had bought on the basis that we’re going into this big new bull market, they start to sell, and we get this move down like that. That is a possibility. It’s a possibility, I think, you’ve got to be aware of.
And if we look at it… But look, before you let that possibility freak you out, look at it from a weekly perspective, and this is how I’m viewing this. Look at it from a weekly perspective. And we’ve had this big move higher in gold, we’ve had this big move higher in gold over a two-year period. This could all still be part of a larger consolidation, it may not be ready to go up yet. When gold goes, and I should say, if gold goes, it will go on its timetable, and we don’t know the path that it’s gonna take to move higher. The move higher could still happen via 1,600, for all we know. And I think over the next couple of years, we could well see gold up here at 3,000. But, look, I don’t know. No one knows whether the path is going to be from where we are now, and we’re gonna start making our way up now, or whether we’re going to have another flush out, and then we’re going to start making our way up. That’s why risk management is just so important.
So, I’m long the gold market. But, you know, look, it’s not an all-or-nothing bet. It never is. It’s never all-or-nothing bet. I know my alternate scenario. And I know that people who get themselves in the most trouble during these periods are the ones who, they go all in, they pile in with a lot of leverage. The market doesn’t follow the path they thought it was gonna follow, and they do themselves a lot of damage. So, I think, we’ve got the breakout. I think it’s important to sort of like go with this break, have our upside bias with gold just here now. Have this upside bias, see if we get support. And I think that’s the way to run with this. If it doesn’t play out, well, I’ll be ready to close out some of my new positions if the price reverses, it’s not like I’m gonna get stuck holding on to my, you know, positions I bought during the breakout, I won’t be holding them down here. I’ll be out.
And just quickly on the positive side for gold. You look at a stock like…look at a stock like Newmont. Let’s have a quick look at Newmont. Look, this has been accumulated since back in December. So this isn’t catalyst-driven accumulation, it has run a long way from its moving averages. And, you know, it might need to consolidate. Look at Newmont on a weekly chart. It’s a very constructive weekly chart. I think the odds favor that this is not the all-time high in Newmont. It may well consolidate, but then I do think the upward trend is going to engage. The same when we look at the GDX gold miners’ ETF. Look, again, I think we’ll get a good breakout here. It may consolidate, but I do think that upside potential is there. So, I’m positive on gold. I think it’s definitely a hold for those who have it. But, look, I wouldn’t be hurrying to rush out and buy new positions just here and now, I’d rather wait and see how the next couple of weeks pan out and see if we get that support coming in.
Now, I’ll wrap up in a sec. But just briefly, I just had someone ask me about…left a comment the other day about oil, it was a couple of weeks ago, and I just haven’t had a chance to get to oil because there’s so many other things to speak about. Look, oil has had a, you know, look, it’s had a huge run, hasn’t it? And just looking at it over the last little bit, we’ve got this spike higher over the last few weeks. Let’s go over to the four-hourly chart. Look, that’s sort of like, what you call like a blow-off top, potentially, where you get this acceleration away from the trend, and then it peaks, and then it quickly gives back all those gains.
So, look, the trend in oil is definitely still up. I’m not getting negative on oil by any stretch. We could see it go higher, but the risk-reward, it’s just so hard to manage your risk here. Like, what is our upside target? For getting long oil here, what’s our upside target? What are we looking for oil to do? It’s really hard. It’s all so tied up around all the geopolitical movements at the moment. It’s a tough one. So it’s one which I’d prefer to, if I had oil in my portfolio, if it’s long oil stocks, I’d continue holding them. I think the trend is great, but I don’t really want to jump on this trend right here and now.
Just looking at a stock like Woodside, for instance. So, the time to have bought a stock like Woodside was probably around here. So the moving average has crossed, broke up to…well, broke to a 70-day high, that’s what I use, 70 is not a magic number, it could be a 50-day high. But it breaks to some sort of a high point. And my motion trader system actually gave a signal to buy Woodside in this region here. And now I think it’s a case of letting it run. And again, it’s just so extended above the moving averages. If I was long, I’d stay long with my trailing stop. I’m not in a hurry to buy it here. And if you’re interested in the sort of signals I’m getting through my Motion Trader algorithmic scans, algorithmic service, just jump over, for my YouTube viewers, I’m happy to give you a free two-week trial. I’ll leave a link at the top of the comment section if you want to come and check out the sort of signals that I’m able to generate through the market, through the algorithms.
And, yes. Look, one stock which came up recently in the signals, which is interesting, Origin Energy. It’s not an oil player as such, it’s more gas, it’s natural gas play, electricity production, energy retailing. And, look, it’s an interesting stock because, you know, you got that positive moving average, you got the positive trend, prices pullback to the moving averages. Looks like it’s starting to bounce. So that’s a sort of stock which I think has the potential to continue to see that sort of price action develop. That’s a sort of risk-reward I like in this current market. This is the sort of stock I wanna buy. I don’t wanna buy stocks which are in this mode, which are in their sale mode. I want to buy them when the price is above the moving average, and I see the potential to do that.
Okay. That’s enough for this week. I’ve talked enough about markets. Hopefully that’s helpful. Thanks for joining me. Thanks for tuning in. Really look forward to coming back next week, and let’s have another look and see what’s happened, what we think we can put together for the next few weeks in advance. So, thanks for joining me. Until next time, I will see you then.
Meet Jason

I'm Jason McIntosh, the creator of Motion Trader. My career began in 1991 on the trading floor at Bankers Trust. Nowadays, I trade my own systems from home in Sydney.
Motion Trader is for investors who value robust analysis, data driven entry and exit signals, commentary, and education. I use engineered algorithms to identify when to buy and sell ASX stocks. No biases or guesswork, just data driven signals.