Trade the Trend | Episode 31
By Jason McIntosh | Published 11 March 2022
Trade the Trend is a weekly video focusing on where the stock market is going. It’s for investors and traders looking for insights to the market’s next move. Jason uses technical analysis and trend following techniques to help you piece together the world’s biggest puzzle.
Where is the Stock Market Going?
00:00 Intro
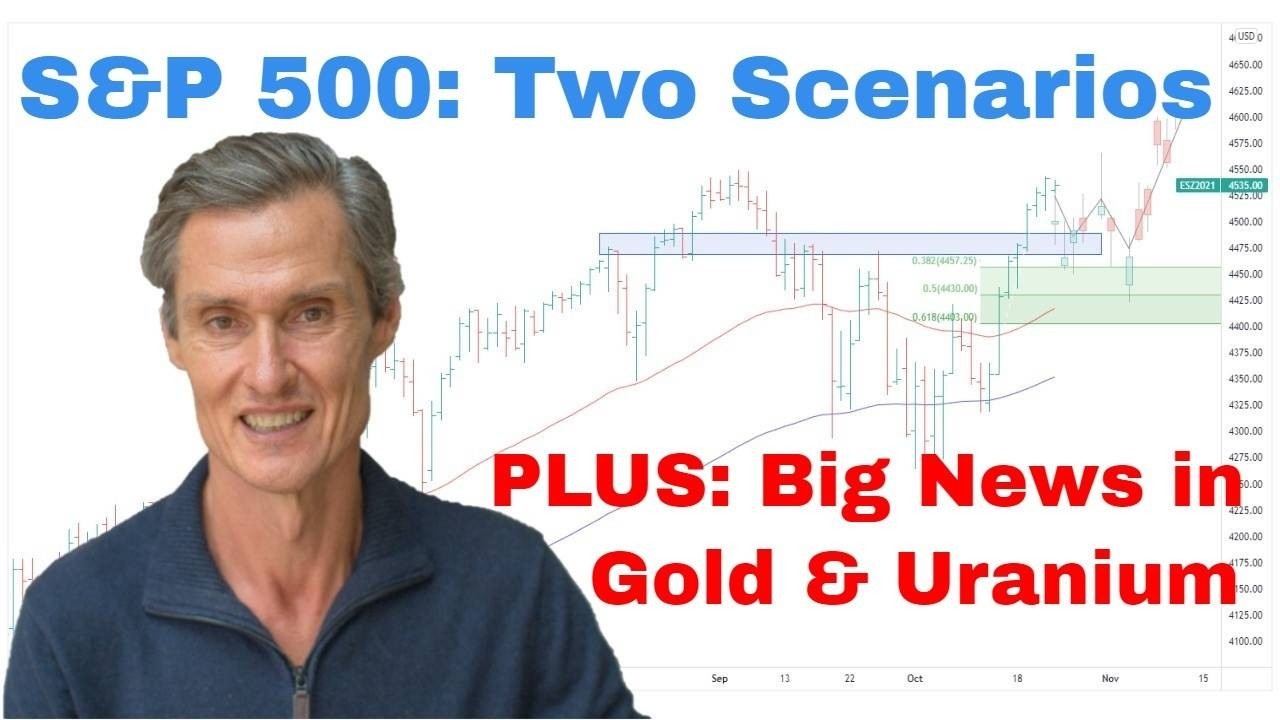
00:21 Where is the S&P 500 going?
13:31 Where is the ASX 200 going?
15:29 What type of stocks to avoid
18:28 Where is gold going?
21:06 Which gold stocks to buy?
22:56 Where is uranium going?
Looking for a free stock market training course?
Learn how to identify some of the best stocks to buy now in this free video training. You’ll learn a complete stock trading strategy for buying and selling shares with confidence. We’ll also share real life examples to help you apply the knowledge and build a profitable share portfolio.
Where to invest now?
Looking for ASX stocks to buy now, as well as off the radar ideas most people don’t know? Our algorithms scan the stock market daily for medium term investment trends. We then tell our members precisely when to buy shares. And most importantly, we tell them when to sell.
If you’re ready to get started, try a no obligation 14-day trial of Motion Trader, and see what an algorithmic trading approach could do for you.
Transcript
Please note: Charts available from video
Welcome to this week’s edition of Trade the Trend, a weekly video discussing where the stock market is heading. I’m Jason McIntosh. It is Friday the 11th of March, 2022. And, as always, this is general commentary and doesn’t take your personal situation into account.
All right. With that said, let’s go to our first chart. Well, I’ve got the S&P 500 on the screen, and off the bat, I’m going to tell you, this is a really hard market to get a handle on. I’ve been watching this market, following this chart closely all week. And from what I can see, there are potentially two setups, which could be coming into play. And they’re both very different scenarios.
So, let’s start by looking at the potential upside scenario. And what I can see on this chart, we do have the potential. There is a bullish wedge forming as the market’s been declining. Just draw that in. So you can see the market has moved into this contracting range. So, look, that’s the makings of a bullish wedge formation. So let’s go over to the four-hourly chart, just to get a little bit more detail on that. And so here’s how that looks on the four-hourly. So what I say here, let’s just do some drawing and sorta map out what could happen.
So if the market were from here, to test lower, and not be able to break below these two lows, you know, the low here and the low here from a couple of weeks ago, but really can’t get below or much below there, maybe it tests lower and fails, and then the market sets itself up for a big short-covering rally. We could see the market quickly retrace those losses, pull back, break to the top side of this wedge, and then start to run. That’s a possibility. That’s a possibility that we’re seeing at the moment. And if we draw the Fibonaccis on here just for that last leg down, you see the Fibs come in here around this 4,400 mark.
So, if the market were able to break upwards from this pattern, get above all this high or these highs from the top of the Fib zone, it could really accelerate out of this pattern towards this region (see video). Look, I don’t think this is a makings of a new bull market by any means. But it does have the potential to push back up towards those highs if we do get that big short-covering rally. And from what I think is happening right here and now is I think there’s a lot of traders out there sitting short the market and they’re waiting, and they’re hoping for a big drop. And if that doesn’t happen, if we do get this test lower, and it doesn’t break, well, then it does set the market up for potentially that big, strong short-covering rally. And that really does then come into focus.
So, let me show you why I think that’s a possibility. So I’m just going to go back to a daily chart… and we did have a look at this last week. It’s a pro-shares short S&P 500 ETF. So it’s an inverse ETF. So if you’re bearish the market, if the market falls, the ETF rallies. And so let me get some indicators. I’m going to put a volume indicator on this chart.
And let’s put on a weekly chart just to compress it up a little bit, gives us a little bit more of what I need to see for this example. So, yeah, let’s just move that. Now, look at this. So here’s the COVID period here and now here we are right now. And just look at the volume profile of both those moves. The volume profiles are actually quite similar. Yet, of course, this is nothing in the magnitude of what we saw on the COVID crash from a price action perspective. So there’s a lot of hedging. There’s a lot of short interest in this market. There’s a lot of nervousness, a lot of fear that it’s gonna fall. So, when a lot of people start positioning for these big moves, well, of course, they can happen. But we also know, you know, the market doesn’t always make things easy. So while the market…it could go low, it very well could go lower over the next few weeks or maybe the next couple of months. But we don’t know the path that its gonna take. So let me just go back to the S&P 500. And let’s remove a little bit of this stuff. So we don’t know the path it’s gonna take.
So look, I still think there’s a possibility that we do get… We actually won’t do it that way, we’ll do it like… actually, I still think there’s a possibility that we see this. We’ve got the A leg down, you know, the first leg of a zigzag, the short-covering rally could be the second wave, and then we set up for the third wave, which maybe does take the market lower. Yeah, that’s a scenario which I still think could play out. And it would fit into that scenario that we do get a short-covering rally. So one of the things which…look, it makes me a little bit hesitant to make that my base case, is that this wedge formation is not playing out as well on the Dow. So let me just go back, get the benefit. Yeah, look, when you put on the Dow, you can still see it, but it’s getting quite steep. Whereas on the S&P, the upward trend line was, sort of, maybe angled a bit like this. This one’s angled but it’s just getting a lot steeper. And then the same on the NASDAQ. When we look at the NASDAQ, you know, the wedge doesn’t work as well. It’s still potentially there but just doesn’t fit as nicely. So look that’s one of my concerns with that scenario that maybe this wedge doesn’t in fact play out. And that’s not the pattern that we should be looking at. So let’s look at it from another perspective. I wanna look at it from what could happen if it turns into a more of a bearish scenario.
And so one of the more immediate bearish scenarios is that rather than being a wedge, what we’re potentially seeing is a cascading type of pattern. So, cascading or a waterfall type of pattern is where the market comes down, bounces, comes down again, then the next bounce is shallower. And what it ultimately sets itself up to do is then to start falling quite aggressively, shallow bounce, and then down again. That’s sort of a cascading pattern. And, look, we can’t rule that out. I think that’s very much on the table as a possibility.
And I’ll give you an example where that’s happened recently. We just look over in Europe. And if we look at the STOXX 50, the DAXs, the German market is quite similar, in that we had this same cascading pattern market fell, bounced, down, bounced, down, bounced, and then once it got below here, it really started to move quickly. The downside was shallow bounces there. That’s sort of like your waterfall or cascading pattern. And I’ve got to say that’s a possibility. So going back to our S&P 500, I think if the market breaks below here, we’ve got these two lows. One from, I think that was on Monday and then one from a week or two before that. The market can get below there, it really does become vulnerable to a fast decline.
And look, it’s just something we can’t rule out. I wish I could have more conviction for you on where this is heading at the moment. But we’re just in that stage of the cycle where we don’t have a dominant trend to hinge off and to give us that underlying guidance as to where we could be going. So when I look at a weekly chart of the S&P 500, this is an upward trend. At the moment from the weekly perspective, really, you’d call this just a modest and regular pullback within a large, weekly trend. But then when we go to the daily chart, you’ve got a different situation. We put the moving averages on, and the 15 100-day moving averages have crossed. So that’s a negative situation from the daily perspective. So we have this conflicting position of the market where from a weekly perspective, you could say there’s a broad upward trend still in play. But from a daily perspective, we need to say, “Well, look, the immediate trend has now turned downwards, there is a potential for a short-covering rally.” But maybe that doesn’t happen. This is what I’ve thought the market’s been setting up for over the last couple of weeks. But it’s possible it doesn’t happen and that it does set itself up to fall quickly like we’ve seen in Europe. So my strategy remains the same.
So I’m staying with stocks that are in my portfolio and that are above their trailing stops. So generally, these are stocks which will probably still be trading above the moving averages. Maybe they’ve come below their averages, but they’re still trading above their trailing stop. So I’m gonna keep those in my portfolio. Whilst I’m doing that, I’m also exiting stocks. I’m exiting those stocks that have hit my trailing stops. So my trailing stops are fairly wide and they’re wide by design. They’re wide by design because I wanna try and see off bouts of volatility. But, you know, volatility like this and like this, like this, and even like this. You can see these bouts of volatility off with wide trailing stops. But then it gets to the point we say, “Okay, I’ve given this enough room to move. I’ve got to exit.” And that’s what I’ve been doing over probably the last maybe three or four weeks now. I’ve been selling down my portfolio.
And that said, I’ve still got a significant long position. But I’ve been reducing my exposure, where these stocks have been hitting the exit points. And I’ve also been buying a few stocks. I think I bought a couple of stocks this week. There are a couple of gold stocks and there’s one industrial-orientated stock. So look, there are still stocks which are triggering signals. But for the most part, we’re seeing more downward action. And my Motion Trader subscription service has actually identified a few new opportunities over the last couple of weeks. So most of these have been in the resources sector, that’s where we’ve been seeing a lot of the positive price action, but then there have been a few non-resource names as well. So, you know, it’s not like everything’s falling and it’s not like everything will fall, we just don’t know. So I’m trying to take the signals where the setups look encouraging, but then avoiding those stocks and getting out of those stocks which are giving us negative price action. So if you’re interested just maybe take up a two-week trial of the service and see for yourself, see the sort of stocks which are triggering signals. Now just quickly, and if you’re interested, I’ll put it at the top of the comment section, I’ll put a link to set up a trial subscription. Now, moving along, let’s have a look at the ASX 200, the Australian market. And local market’s been holding up quite well. And it’s, I think, look, largely it’s been held up by the mining stocks. So it’s been a big rebound in iron ore. We spoke about the potential for a big rebound on iron ore.
I don’t know, it might have been about two months ago when it was quite down and out. We did our Fibonacci retracements on it and we said look, “There’s a big potential for iron ore to rebound and that would underpin the local market.” And that’s pretty much been what’s happened when the likes of BHP and Rio Tinto, and Fortescue have all traded higher, and are also getting support from some of the value names like some of the banks, they’ve been holding up quite well through this as well. On the negative side, they had the tech-orientated stocks being a drag on the market, but net-net the Aussie market has done fairly well.
I think if we see a break below these couple of lows here from last week and a week or two before there, it would open up the potential for more selling. But look having said that, I think the risk of a sharp move lower is more likely in the US, it’s less likely in the Australian market. Well, this is for a couple of reasons. One, the Aussie market is already trading below its COVID highs whereas the US market is still well north of these COVID highs. And also there’s this big resource waiting in the local market, in the ASX 200. I think that has the potential to give the market some sort of support. As I’ve been saying, I’m gonna consider opportunities where stocks are above the moving averages. And it’s just not the time to be playing the hero and going out there and buying some of those falling market favorites. Those stocks which have done really well in the previous advance, which are now falling and below the moving averages, I just don’t think it’s a time to be playing those. I think that’s a risky game.
I’ll just give you a quick example. I was on a news program, a program called Ausbiz during the week. And I was talking about stocks to avoid. This is one of the ones I said, “Well, it’d just come up on emotion trader as a short signal. So even if you don’t short it, you certainly don’t buy it.” And I brought this up as an example of the sort of stock to avoid. Because what we have here, we’ve got these moving averages that have turned lower, and the price is now below the moving averages. Now, I made the point, I said look, “Buy the dip can be a great strategy, but you’ve got to apply it at the right time.” So through this section here is where you’d apply Buy the Dip. When the price is coming back towards the moving averages, that’s where you buy the dip because then you can control your risk and you set exit levels a little bit below and you’re playing for that trend to continue and to rebound and go higher.
This is the time to play the dip. Now we’re in the phase where it’s more of a case of sell-the-rally. So don’t buy the dip, sell the rally. That’s how I’d be playing a stock like Nick Scali. Now at some point, it’ll bottom, well, probably will bottom. And it’ll be, you know, like down here, it did bottom and a bottom is when it’s below the moving averages. But you don’t know for how long it’s going to stay below. We don’t know where that bottom would be. Is it going to be somewhere around here? It’s going to be somewhere around here? Is it going to be somewhere around here? You don’t know, that’s why Buy the Dip is dangerous when the market’s below the moving averages because all the bad stuff happens when the market is below the moving averages so it’s risky. And what was interesting and why bring this up is because one of the hosts made the comment, was that there’s a school of thought that there have been all these floods down the Australian east coast. And there’s going to be a big refurnishing of houses with new furniture given all the old stuff’s been destroyed. And that’s gonna support a stock like Nick Scali which is furniture-orientated.
And my point to that was that may well be true, but let’s wait for the price action to tell us that there’s an opportunity developing. So rather than pre-empt a story that could or may not occur, let’s wait for the price action to tell us. Let’s wait for the price action to start turning higher, getting north of these moving averages, then maybe you’ve got a play. So, whether it be Nick Scali or any other stock which is below its moving averages, in Australia, in the US, in Europe, wherever it may be, it’s the danger zone for stock purchases. It’s a vulnerable time when they’re below those averages. And look, if you’re getting some value from these videos, please hit that Like button and also leave a short comment even if it’s, “Hey, like the video.” It just shows YouTube people are watching, people are engaging and then YouTube shows new people and people watch and I’ll make more videos. It all really helps. So please do that for me.
Now, let’s move on to gold. Interesting stuff in gold this week. Where’s my chart for gold? Here we go. Here’s our daily chart for gold. So I’ve left our big trading range on there, that we broke up from about, I think we were first talking about this break, maybe three weeks ago now. And last week around here…last week, look, I said, “I’d really like to see this market pause and consolidate.” I’d like to see it you know, pause and, you know, consolidate here and then move higher, but didn’t do that, market didn’t want to wait for that consolidation. It has just continued higher. So, as I said, we’ve got the bullish break, we just need to go with it. And one thing now though, is I hate chasing gold stocks once they’ve done this because we’re now so far above the moving average, gold stocks have a habit of running hard and then pulling back hard.
So I’m just hesitant to chase gold stocks at this point. It’s a case of holding the gold positions which I had, and then being ready to add to those positions or add to new stocks as opportunities present as we move forward. So it’s not a case of just pile everything into gold now, assuming it’s gonna continue lifting off because that’s probably not going to happen. Like the moving averages are a bit like gravity, in that you’re looking at it through here, it gets well above, and then gravity pulls them back down, get above the moving averages and gravity pulls them back down. So at some point, gravity’s gonna cause this market to either pause or pull back. Look, it could go higher.
That’s why I say like, “Yeah, we’re not trying to get clever about this and take profit on our gold stocks with the idea of buying them back lower.” That is a dangerous move because that’s when you do miss out. You exit and this market keeps going. But it’s a case of holding what you have, well, that’s what I’m doing. I’m holding what I’ve got and I’ll look for opportunities to add those positions later on. And the sort of stock which I I’d consider now is, like, a stock like Northstar is interesting now because it hadn’t…like, these are the lines we put on last week. If you didn’t watch last week, I drew this thing as a bullish wedge. It’s not how you draw a bullish wedge with these bits hanging at the top and the bottom. But it was just to show the contracting nature of the price action. Markets moved a bit higher again this week. But it’s not too far from these moving averages, it’s not too far from its breakout point.
So if I had no gold and I needed to get a position, I’d consider a stock like this because I could get in around here and really, like, I look at my risk. You know, maybe it’s 16%, even if you’re allowing for 20%, your risk is relatively small compared to, you know, the upside which is like a multiple of the risk. So same like Northstar, for me, look, it’s still one which I can consider. Where there’s others like, well, let’s have a quick look in the US at Barrick. Barrick, look, for me it’s run a little bit too far above its moving averages, I’d rather see a pullback before running into something like that. Ideally, I’d already had some onboard where the breakout was, if I was playing that stock in that market. I’ve got exposure to Barrick. I actually do have exposure to Barrick but it’s through the ETF, the VanEck Gold Miners ETF.
I think for a lot of people that’s a good way to play the gold sector, avoids the risk of getting the right sector but being in the wrong stock. This gives you exposure to a broad portfolio of stocks. That’s a good one to consider. And just lastly, I’m gonna briefly look at uranium because that’s been very interesting as well, like really, big move. Look at this. Look at this big move head in uranium. And we spoke about uranium, I think it was two weeks ago, maybe it was three weeks ago. I don’t quite remember. It’s just here, we just had that update. And we said look this is interesting, we’re getting some momentum, it’s worth continuing to watch and I drew this line here I said, “Look, you know, break above this high will be the next sign that this has gained momentum.” And it could look like uranium is back in play. And that certainly proved to be the case.
So it’s just a great example of how momentum is a really good early warning or a really good indicator that, you know, something’s happening in the market, both either good or bad. And that’s proved to be the case with uranium and just looking at one of the uranium plays. A look at an ASX uranium play, Paladin Mining. And interesting here because we’ve got this downward trend channel which is formed since…when is that? That’s September, so over the last few months we’ve had this form and we’re right now at the upper bound of this trend channel. So it’s gonna be interesting to see what happens here. Because what I think should happen should this play and uranium continue to run, we should see this break higher. So gonna be interesting. Keep an eye on Paladin. Look, keep an eye on all the uranium plays basically I think. I think because it’s interesting we’ve got that breakout in uranium.
So look, let’s leave it there for this week. A lot of interesting things going on, a lot of confusion with that USA equity index. Is it going to get the short-covering rally or is it going to break down? We’ve really got to watch how this plays out over the next couple of days. We might learn a lot over, you know, by maybe Friday in the US, maybe by the time you’re watching this tomorrow, we’re gonna have a big move either way. So really interesting to watch it and we’re going to see what happens. Let’s come back next week and have another go at putting those pieces together. Thanks for joining me and I will see you next time.
Meet Jason

I'm Jason McIntosh, the creator of Motion Trader. My career began in 1991 on the trading floor at Bankers Trust. Nowadays, I trade my own systems from home in Sydney.
Motion Trader is for investors who value robust analysis, data driven entry and exit signals, commentary, and education. I use engineered algorithms to identify when to buy and sell ASX stocks. No biases or guesswork, just data driven signals.