Trade the Trend | Episode 30
By Jason McIntosh | Published 4 March 2022
Trade the Trend is a weekly video focusing on where the stock market is going. It’s for investors and traders looking for insights to the market’s next move. Jason uses technical analysis and trend following techniques to help you piece together the world’s biggest puzzle.
Where is the Stock Market Going?
00:00 Intro
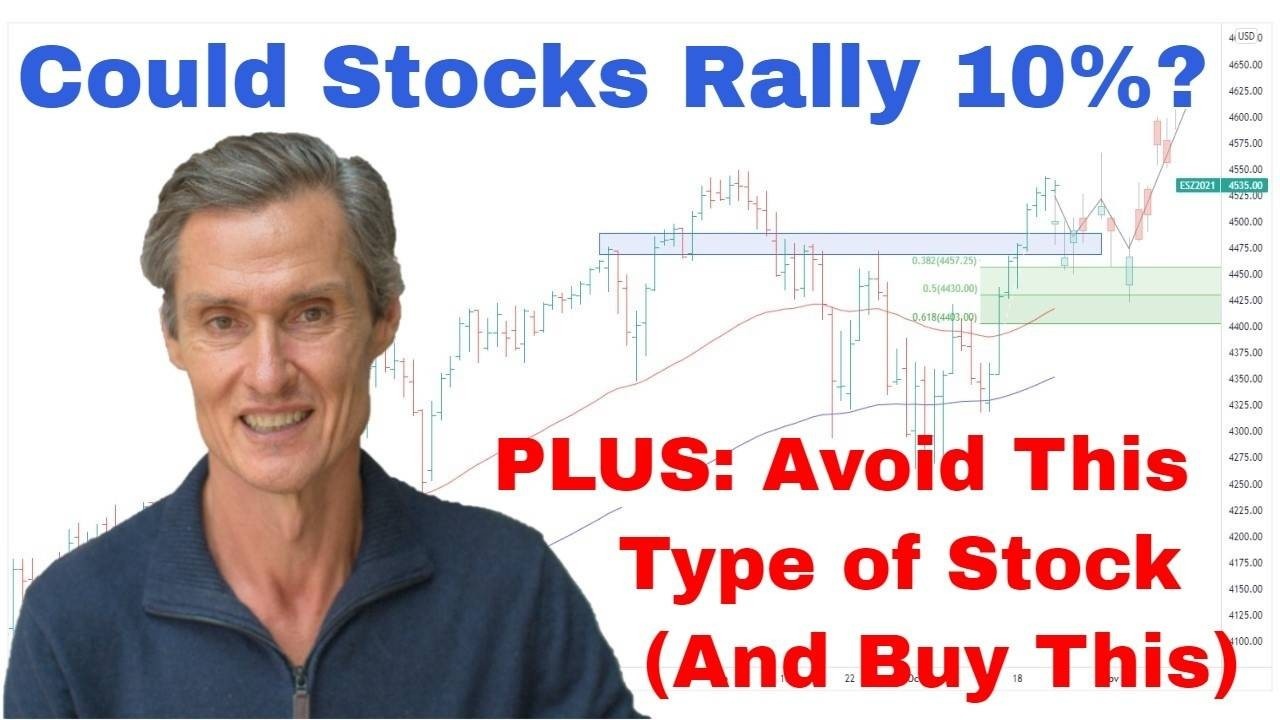
00:21 Where is the S&P500 going?
12:24 The type of stock I’m avoiding
16:12 The type of stock I’m considering
18:50 Where is the ASX 200 Going
20:24 Where is gold and gold stocks going
26:27 Where is uranium going
27:48 Where is copper going
Where to invest now?
Looking for ASX stocks to buy now, as well as off the radar ideas most people don’t know? Our algorithms scan the stock market daily for medium term investment trends. We then tell our members precisely when to buy shares. And most importantly, we tell them when to sell.
If you’re ready to get started, try a no obligation FREE 14-day trial of Motion Trader, and see what an algorithmic trading approach could do for you.
Transcript
Please note: Charts available from video
Welcome to this week’s edition of “Trade the Trend,” a weekly video discussing where the stock market is going. I’m Jason McIntosh. It is Friday, the 4th March 2022. As always, this is a general commentary and doesn’t take your personal situation into account.
All right, with that said, let’s get straight into our first chart. Now, look, as I’m recording this, volatility is starting to pick up. I’ve seen reports about shelling of a nuclear power plant in the Ukraine and this is time to unnerve the market somewhat. And we’re seeing some volatility during the Friday session in Australia. And look, this is a volatile and it’s an uncertain time, and there’s naturally a lot of fear, and a lot of emotion coming into how people are approaching this market. So, hopefully, over the next 15 minutes or so, we can step back and we can look at these markets objectively and not emotionally.
Now, there’s plenty of scope for me to get things wrong here. There’s a lot of movement. There’s a lot going on. But I think we may have seen a notable low in the U.S. market last week, and in the Australian market as well, for that matter. I’ll talk a bit about that in a few minutes. But what we’ve seen here, we’ve got this spike low. We’ve seen the market rebound quite strongly and it’s been grinding high this week. It’s messy. It’s choppy, but it’s been holding in there. And just from my reading, my read of the technical state of this market and also other indicators, which I’m looking at, suggests that maybe we do have some sort of an important low, at least a temporary one.
And so what I’ve been seeing? I’ve been seeing reports of there’s been a lot of hedging activity in both…They look globally, really. There’s been a lot of hedging going on. But particularly in that U.S. market, I’m seeing reports of a large amount of put buying. So, when people buy a put option, they’re either hedging their portfolio or they’re speculating on further downside. And what we’re also seeing is we’re seeing a lot of volume going through those inverse ETFs, so those bear market ETFs, where when you buy an inverse ETF, the price goes up when the market falls. So it’s a way of hedging a portfolio.
So I want to show you what I mean. I want to just quickly jump over and show you this ETF. So the PROSHARES SHORT S&P500 ETF. Now, what I’m going to do, I want to put a volume indicator on this. And then I want to put this onto a weekly chart. So one time, I want to show you want to compare this to another key part of history, and this was COVID crash. So I want you to have a look at this. I want you to compare the two. Compare the volume profile from the COVID period to the current period. And you see, they’re quite similar. But this was a full-scale crash. This so far is like a 15% decline. And people are so on edge, I think, that they’ve been very eager to start getting hedging in place in their portfolios.
So, you know, from the way I see this, the market is just not set up for a crash, because crashes are blindside events. They come from left field, they take people by surprise, and they cause tremendous damage to portfolios. When you get a situation where a large portion of the market is getting themselves either hedged or encashed, that’s not so much of a market crash setup because people are ready for it. You can’t blindside a market that’s prepared. It doesn’t, kind of, work like that.
So rather than a crash, what I think might be happening here, let me just jump back to that S&P chart. Jump back to the S&P, there we go. And I’ll just get rid of the volume. We don’t need that here. So what I think might be happening is I think this market could be setting itself up for a short-covering rally or maybe it’s a hedge unwinding rally. And these rallies when they happen, they can go a long way, and they can be quite volatile. So they’re not just in a straight line.
They’re up and down, and they’re difficult. And that can last several weeks. So what we could possibly really see happen is that we could see something like this over the next several weeks. So, whether it’s to that magnitude or whether it only got to there, I don’t know. But let’s just say we had the potential to see the market rally from here around 5% to 10% over the next several weeks, whether it’s from here or whether it has another fall, maybe it comes back down and gets close to this low point. But provided this low holds, that’s what I think the market is setting up for. Look, as I said, lots of scope to be wrong on this, but I think this is something which we should have in mind with our portfolio positioning. So people now who are getting heavily hedged and going to cash, be aware that something like that could occur over the next few weeks.
But, look, as I’ve been saying the last couple of weeks, I don’t think this is over. I don’t think this corrected or consolidated period is over. And you see markets typically correct in two ways. They correct in price, and we’ve been talking about pricing and the market’s down 5%, 10%, 15%, what have you. And they also correct in time. And this is something you don’t… Look, we’re saying, you don’t hear talked about quite so often in the time component. But that’s a really important part of the correction because it’s the time part, which brings a chart back into balance.
And so I want to show you what I mean to do that, I’m going to go to a weekly chart because this will help put some perspective around what I’m talking about. So, let’s talk about some averages for a moment. So the average duration of a bear market is about 30% as long as the average bull market. So the S&P 500 isn’t an official bear market yet. And maybe it won’t go into one. Maybe this is just a pullback within this larger bullish trend and maybe we’re going to go higher again. My feel, my leaning is that that’s not the case. My leaning is we’ve now started a correction of this whole advance. I think this whole advance is in the process of now being corrected. Could be wrong but that’s the basis of which I’m looking at this point in time.
So let’s measure how long the advanced took. So if we measure this out, the advanced talk, it’s 93 bars. So, it’s just short of a couple of years. And then we look at what we’ve done so far. And it’s not very long. We haven’t pulled back very far. And we’re not very far into it. So, yeah, if you work out 30% of 93 bars, it comes around 27 bars or 27 weeks. So if we put that on the chart, let’s just measure out a 27-week period, comes to…I’m just looking at the…In that red box, I can see the number of bars, which I’ve moved across as 27 there.
So it’s possible that we’re only a third of the way into this corrective period, if it is the case that we’re correcting this move here. So, of course, now, these things don’t work with precision and I’m talking about averages. So it’s only a rough yardstick, you know, things can move either side of the average by considerable margins. This is only giving us a guide to how things could play out over maybe the next couple of months. And if we were to see, you know, a correction within here, look, we don’t know what’s going to happen if it’s within these bounds. All sorts of things could happen near the pathway the market could take.
But one of those possibilities is the classic zigzag we get the ABC decline. A, B. B could be the short-covering rally. Maybe we get that short-covering rally, maybe it’s, you know, the wide B within the zigzag, and then you get the C decline, you know, in a month or two, potentially. It is crystal ball stuff because nobody knows. It’s looking at the possibilities but looking at historical precedent of how these things can work through. This is certainly one of the scenarios, which is on the table. And then, of course, the other side to these corrected periods. So that’s time…So that would be looking at the time frame, which it could take to work through. Then the other side, of course, is price.
So let’s put the Fibonaccis on this move and give some idea. So, if we did a Fibonacci retracement of this entire fall or this entire game, well, then you could see this market come back to around this 3,800 sort of mark. That’s around the 38.2%. And just giving a…Let’s just work out like how far that is. That’s about 20%. And I do think this market has potential to give us that 20% correction, which has been spoken about for so long and so many areas, people saying, “Oh, the market needs to have 20% correction.” Maybe this is time, and maybe this is how it could potentially play out. Another thing the market would potentially do is like, look at this blue line is a 100-week moving average. So I just want to scrunch this up a little bit, go back in time. And if you just look at the touchpoints along the 100-day moving average, as we go through time, you’ll see that it comes back to the 100-day moving average, maybe once in every one to three years.
So, it’s now been around two years since the market last fell below the 100-day moving average. So maybe that is part of this corrective period. Maybe it gives us a guide that this market needs time and it needs a bit more on price if in fact it is a correction of this larger advance. So, it’s going to be interesting to watch how this plays out. While I do think there is a potential that we do get a strong bounce over the next…look, it could be the next few weeks, its timeframes are so hard because you just we just don’t know as I keep saying. It’s like just working out possibilities. But if we do get that strong bounce, I would be inclined to be selectively buying stocks, but I don’t want to rush out and buy everything because I think there’s a lot of risk in this market still. So I’m avoiding stocks that are trading below their 50 and 100-day moving averages. I think they’re the riskiest plays in this market. And if we do see a strong rebound, this can be the temptation to buy some of those fallen favorites that have come back a long way.
So I’m just going to quickly run through and give you a couple of examples of the sort of stock, which I’d want to avoid in this period. So, look, one example is dominate paces. So this was a real winner during the COVID period. And you can see it had this really strong rally during 2020 and ’21, then start to lose momentum and the moving average has crossed. Actually interesting. I’ve got these markings on the chart from when I spoke about this. We spoke about this a couple of months ago, I think. Maybe it was around here.
The price had just broken below supported broken below trendline. And my point at the time was dangerous time to be buying a stock like Domino’s because the momentum shift and it’s breaking down. It’s not a time to buy the dip. And that’s in fact exactly how it’s turned out because the vulnerability of the stock has been to the downside, and it’s fallen lower. It’s down another 20% since we’re all speaking about it here. And the temptation always is when you get a stock down here, people say, “Oh look, it’s come back. It’s come this far.
It was such a great stock. A year or two ago, it’s going to go back up.” But once those moving averages crossed and the price is below the moving averages, it becomes a case often of its sell the rallies rather than buy the dip. And that’s what’s happened in Domino’s. I’ll give you another example. This is another stock which did really well during the COVID rally period, and Domain Holding Group. So, what we had when the moving average has crossed. We got a great upward trend. But then look conditions changed.
They always do at some point. So once those moving averages crossed, this became a dangerous stock to be buying. So look, I’m sure a lot of people would have seen this stock here and thought, “Look, it’s down 25%, 30%, this is a great time to buy the dip.” So we had the initial attempt to buy the dip and people would have been thinking, “Well, look, you know, it’s time to recover. It’s time to buy. Look at the moving averages. The stock is below the 50 and the 100-day.” So, it’s not a time to buy time to be careful. This was a time of silver rallies and of course, this is what’s happened. It’s continued to lower.
Now, of course, stocks will ultimately bottom and they’ll be below the moving averages. So at some point, these stocks do rise but the path of least resistance whilst moving averages are trending lower is for the stock to trend lower. So it’s a dangerous time to be buying the dip. I’d rather wait for a stock like this to base, start turning higher, wait for the moving averages to round higher with it, and then that gives you your entry point. And this is a sort of stock I want to avoid during this period, which we’re currently in because I think they’re the most vulnerable.
And I’ll just give you one more quick example. TPW, Temple & Webster Group, so this was another boom stock, which, you know, huge gains in this from, you know, $1 up to $14 but then the moving averages turn, the momentum shifts, and it goes from buy the dip to…Like, buy the dip is through this period here, as the markets rising, it pulls back towards moving averages, buy the dip. Even here, you could still say buy the dip. Once we’re below the moving averages, it becomes sell the rally, sell the rally, sell the rally. And it’s declining. So even here, I think it’s a case of sell the rally, don’t buy the dip. Buy the dip can be a great strategy, but you just got to know when to apply.
This is a risky situation. There are lots of stocks in the market like this now. So, that said, there are stocks which I think you can consider. So I’ll give you examples of where I am looking at potential opportunities. So, Rio Tinto is one example. So Rio is a stock, my motion trader serve a signal to a couple of times in the last two months, moving averages have crossed, shares have broken to a 70-day high, momentum has shift to the upside. It’s now a case of like buying into that momentum. And this is like…Commodity is doing well. We don’t know.
Of course, we don’t know how the next few month is going to go. But we’re buying stocks, I’d rather be buying a stock like this, which is showing strength. It’s above us moving average. It’s trending higher, and that has potential to continue running. Another stock which I’ve had buy signals for through my motion trader service recently has been Woodside. So Woodside is an oil stock. So you can see through this period here, there was a time to just leave it alone. But we do have the moving average cross now and we do have the momentum shifting to the upside. And I think I got a buy signal somewhere in here for Woodside.
And I think we’ve had another one recently up through here somewhere. So look, it’s a stock which is trending higher, has momentum on its side. And just briefly and I’ll come back and talk about gold again in a moment. But another one, which is interesting, which I saw recently come up in my buy signals was Anglo gold. This is the Australian listing of Anglo. Got those moving averages crossing. And this is a sort of stock I want to be buying. I want to be trading with the trend, not punting the low point in something like Domino’s Pizzas. So this is just that difficult part of the cycle we’re currently in. I think this is all about…It’s about capital preservation. It’s so important during these periods.
So it’s about forgetting bold moves like trying to buy Domino’s or Domain, or you know, one of those falling or fallen market favorites. And it’s about being selective in what you buy, and it’s about doing what you can to ensure you come out the other side with capital intent. And as I often say, you know, the winner in a bear market who are in a correction is, you know, the person who loses the least, who has the strategy to exit stocks when it’s time to exit and to avoid buying stocks which are in downtrends. And that’s what I’m trying to help you guide you through these videos and with my motion trader service.
Now, just quickly, I just want to just duck over and have a look at the ASX200. And let’s just go straight to the hourly charts on this one here. So look, last week we were down here and I saying look I just felt like this market was struggling to break these lows and felt like it needed some sort of an upward reaction. And that’s what we’ve had during the week. It hasn’t been plain sailing by any stretch. It has been a very volatile, zigzagging path higher and it’s still doing that. But this is what I think the situation we’re currently in now is that these markets have become the Bridgestone oversold state, where a lot of the people who wanted to hedge or sell have sold and we could be at a point where it does spring back in the other direction. And as I said, look, I’ll consider opportunities in these markets that only stocks, which are above the moving averages.
I don’t think now’s the time to play the hero and go in and start, you know, buying up stocks which are down a lot because maybe they don’t rally back so Will if we do get a snapback. And there’s no guarantee we get a snapback rally either. It’s a possibility. It’s a possibility based on what I’ve seen in the past and on the historic precedent of how these moves often play out from a time and price perspective. So let’s go over. I want to look at a gold this week, because gold’s been really interesting. This is the big range we spoke about last week, which gold has broken out of. And it’s continued to trade really well. The question now is, is gold going to pause around here or is it going to keep rallying? So, my preference for, like, the market doesn’t care what my preference is, of course. But what I’d like like to see gold do, I’d like to see gold consolidate.
I’d like to see it, come back and do some work in this region here, and then see the buy the dip traders come in, support the price, and then start to push it higher and then get another breakout. That’s textbook. That would be great. And that would give a lot of confidence in buying a breakout through there. It’s putting the Fibonaccis on. Like, you know, that would bring it back into the Fibonacci range. You know, maybe that 1870, 1850 sort of area, that would be nice to see gold do that, because what consolidations and pullbacks do, firstly, they’re completely normal following a breakout, but also, they’re really healthy and helps increase the likelihood that we get a sustainable, big medium-term advance, which I think is very much possible for gold at this point.
But look, we need to see how it plays out here. You know, the concern I have, the one nagging concern I have is that this is very much catalyst-driven. It’s been very much driven by, you know, tanks rolling through streets, and people see that and they buy gold. You know, the one possibility is that if the hostilities do die down and the tank start going home, that the people who bought gold on that basis, start selling and then we get the price fall away. That’s a concern. That’s a possibility. It’s a scenario, it’s not the base case.
I think look, we’ve got a clear breakout. I think we do need to go with it. But it’s being aware that there is a lot of catalyst-driven price action in buying going in here. That’s why I’d like to see the pullback, find support, find fresh buying, and then start to push the price action higher. That would be a great development for gold. So we just have to see whether it does play out like that. So just looking at an opportunity in the gold sector, I want to go over and just quickly have a look at…Let’s have a look at North Star. So North Star’s, you know, a large ASX listed company.
And so what I want to do with this and then we just had these on from something previously I was looking at, so what I want to do with this is like let me just paint the picture with North Star. So this looks…Northstar’s price action looks quite similar to that of other gold producers, other big companies like Evolution, like Newcrest to the larger Australian, big Australian producers. Also resembles a lot of the mid-tier North American stocks. Have all got the same pattern, we’ve had a big move down.
Then over the last year, we’ve kind of traveled sideways in this wedging-looking formation. So, I’ll draw a wedge on this chart. Now, this isn’t a true wedge. It’s not a proper wage. It’s not how you draw a wedge but just want to like focus your attention on the narrowing of the price action. So I’ll explain a little bit more in a sec. So, if we draw this in like this…So this is not how you draw a wedge because you don’t have these bits sticking out either side of it. But it is wedging price action, in that you can see that the price action is coming through here as narrowing.
So it’s a wedging type of price action, even though the pattern is not properly formed. And what we have is we’ve recently had the breakout to the top side. So this is looking really encouraging and it’s just been tracking sideways over the last few days. So look, maybe if we see this continue to just track sideways and then start to break upwards, that’s going to be looking very interesting on the chart. We’ve also got these moving averages are close to crossing some close to getting a buy signal for Northstar, Evolution, Newcrest, they’re all in there. There’s [inaudible 00:25:00]. There’s North American ones.
They’re all shaping up with this sort of pattern. So look, I think…And they’re also breaking up of support. So we’ve also got, like lots of support, like through… You know, this is really rough and ready. But yeah, we’ve got support through there, which with Northstars breaking off, bouncing off, and you can get the same sort of support region on quite a few other stocks. So, I think, yeah, look, as I said, with gold, I think we’re going to look at this break, where to run with this break and then see where it takes us. And also, I think this is shaping up as a very asymmetric risk-reward trade, in that your upside is up here but your downside risk can be managed with stop losses, just below the price action we’re currently is.
So, your risk-reward is very positively skewed to the upside. It doesn’t guarantee it’s going to work out. But then that’s the way you want to play your odds, you want to play your odds where you’re getting a lot of upside, that you’re managing your downside. That’s how you make money in markets. And a lot of people do it the other way, you know, small upside, but don’t use exit stops and a big downside. And that just doesn’t work out too well. So, very briefly, I’m going to have a quick look at Uranium.
That’s been very interesting since we spoke last week. Last week we spoke, it was just here. It continues to break higher. Going to be interesting. By the time you watch this, you’re going to see Friday day in the U.S. It’s quite possible we’re going to see Uranium pull back tonight with this talk of shelling of nuclear reactors. So, let’s just see what happens. But what’s going to be interesting here is what happens if and when Uranium comes back. Is it supported and does it start to push back higher again? There’ll be a telling sign to see whether there’s underlying demand to support the price and buy it on a dip. That’s what you want to see. We want to see the price…If the price does come back, we want to see that pullback bull and the price start to move higher again. That’ll be a real good sign that Uranium could be on the move to higher levels.
Alternatively, if we fall back down we could just be stuck back in the range. We’ll have to see what happens. So, bit of a pivot point for Uranium tonight to see how it handles its current news we have coming out. And lastly, I’m going to finish on copper because I’ve got to touch on this week because stuff happening it’s done make the video too long but when things are happening, you want to have a look at it.
So, this is a big range we’ve been looking at in copper for ages now. This has been in place scenes, back in May last year. So we have this great rally over one year in copper and now we’ve had the big consolidation. Now we seem to be getting the breakout. So look, let’s watch is a lot of interest because this has a potential. This breakout sticks. You know, we could consolidate but, you know, it could be often away. This could be something really important happening in the copper market from a price perspective and we could have some good upside coming.
And it is very interesting because we spoke about…I think it was three weeks ago, we spoke about this stock here, the global copper miners ETF, Corp X listed in the U.S. It was just here, just we were talking about it on “Trade the Trend.” And we talked about how this had broken high, had broken took two what was that? I don’t know what that. It was like a nine-month high or something and it was above the moving averages. It looked like it was getting momentum and that’s continued to be the case. It’s continued to rally. And, you know, we spoke about at the time was when we said like is this pre-empting a break in copper.
And it looks like that’s very much what’s happened. So look, going back to what I said earlier, if you want to be buying things in this market, I think these are the things you want to be buying. You want to buying stocks with momentum to the upside, which are trading above their moving averages. And that’s where I’m seeing the opportunities. They’re coming up in my motion trader service through the algorithmic signals, through the scans that I’m doing.
And just when you go through the charts, you can see the setups. You can see the ones which offer the offer that potential, that upside potential with where you can manage your risk. And so, let’s leave it there for this week. There’s a lot going on. And hopefully, that helps put some clarity around where we are and some perspective. Let’s come back next week and let’s see where we are and try and put all those pieces together again. So thanks for joining in. Been great talking with you. See you next week.
Meet Jason

I'm Jason McIntosh, the creator of Motion Trader. My career began in 1991 on the trading floor at Bankers Trust. Nowadays, I trade my own systems from home in Sydney.
Motion Trader is for investors who value robust analysis, data driven entry and exit signals, commentary, and education. I use engineered algorithms to identify when to buy and sell ASX stocks. No biases or guesswork, just data driven signals.